Apple Inc.(NASDAQ:AAPL) Stock price target trend forecast and trading range analysis:
Updated to: 2023.2.3
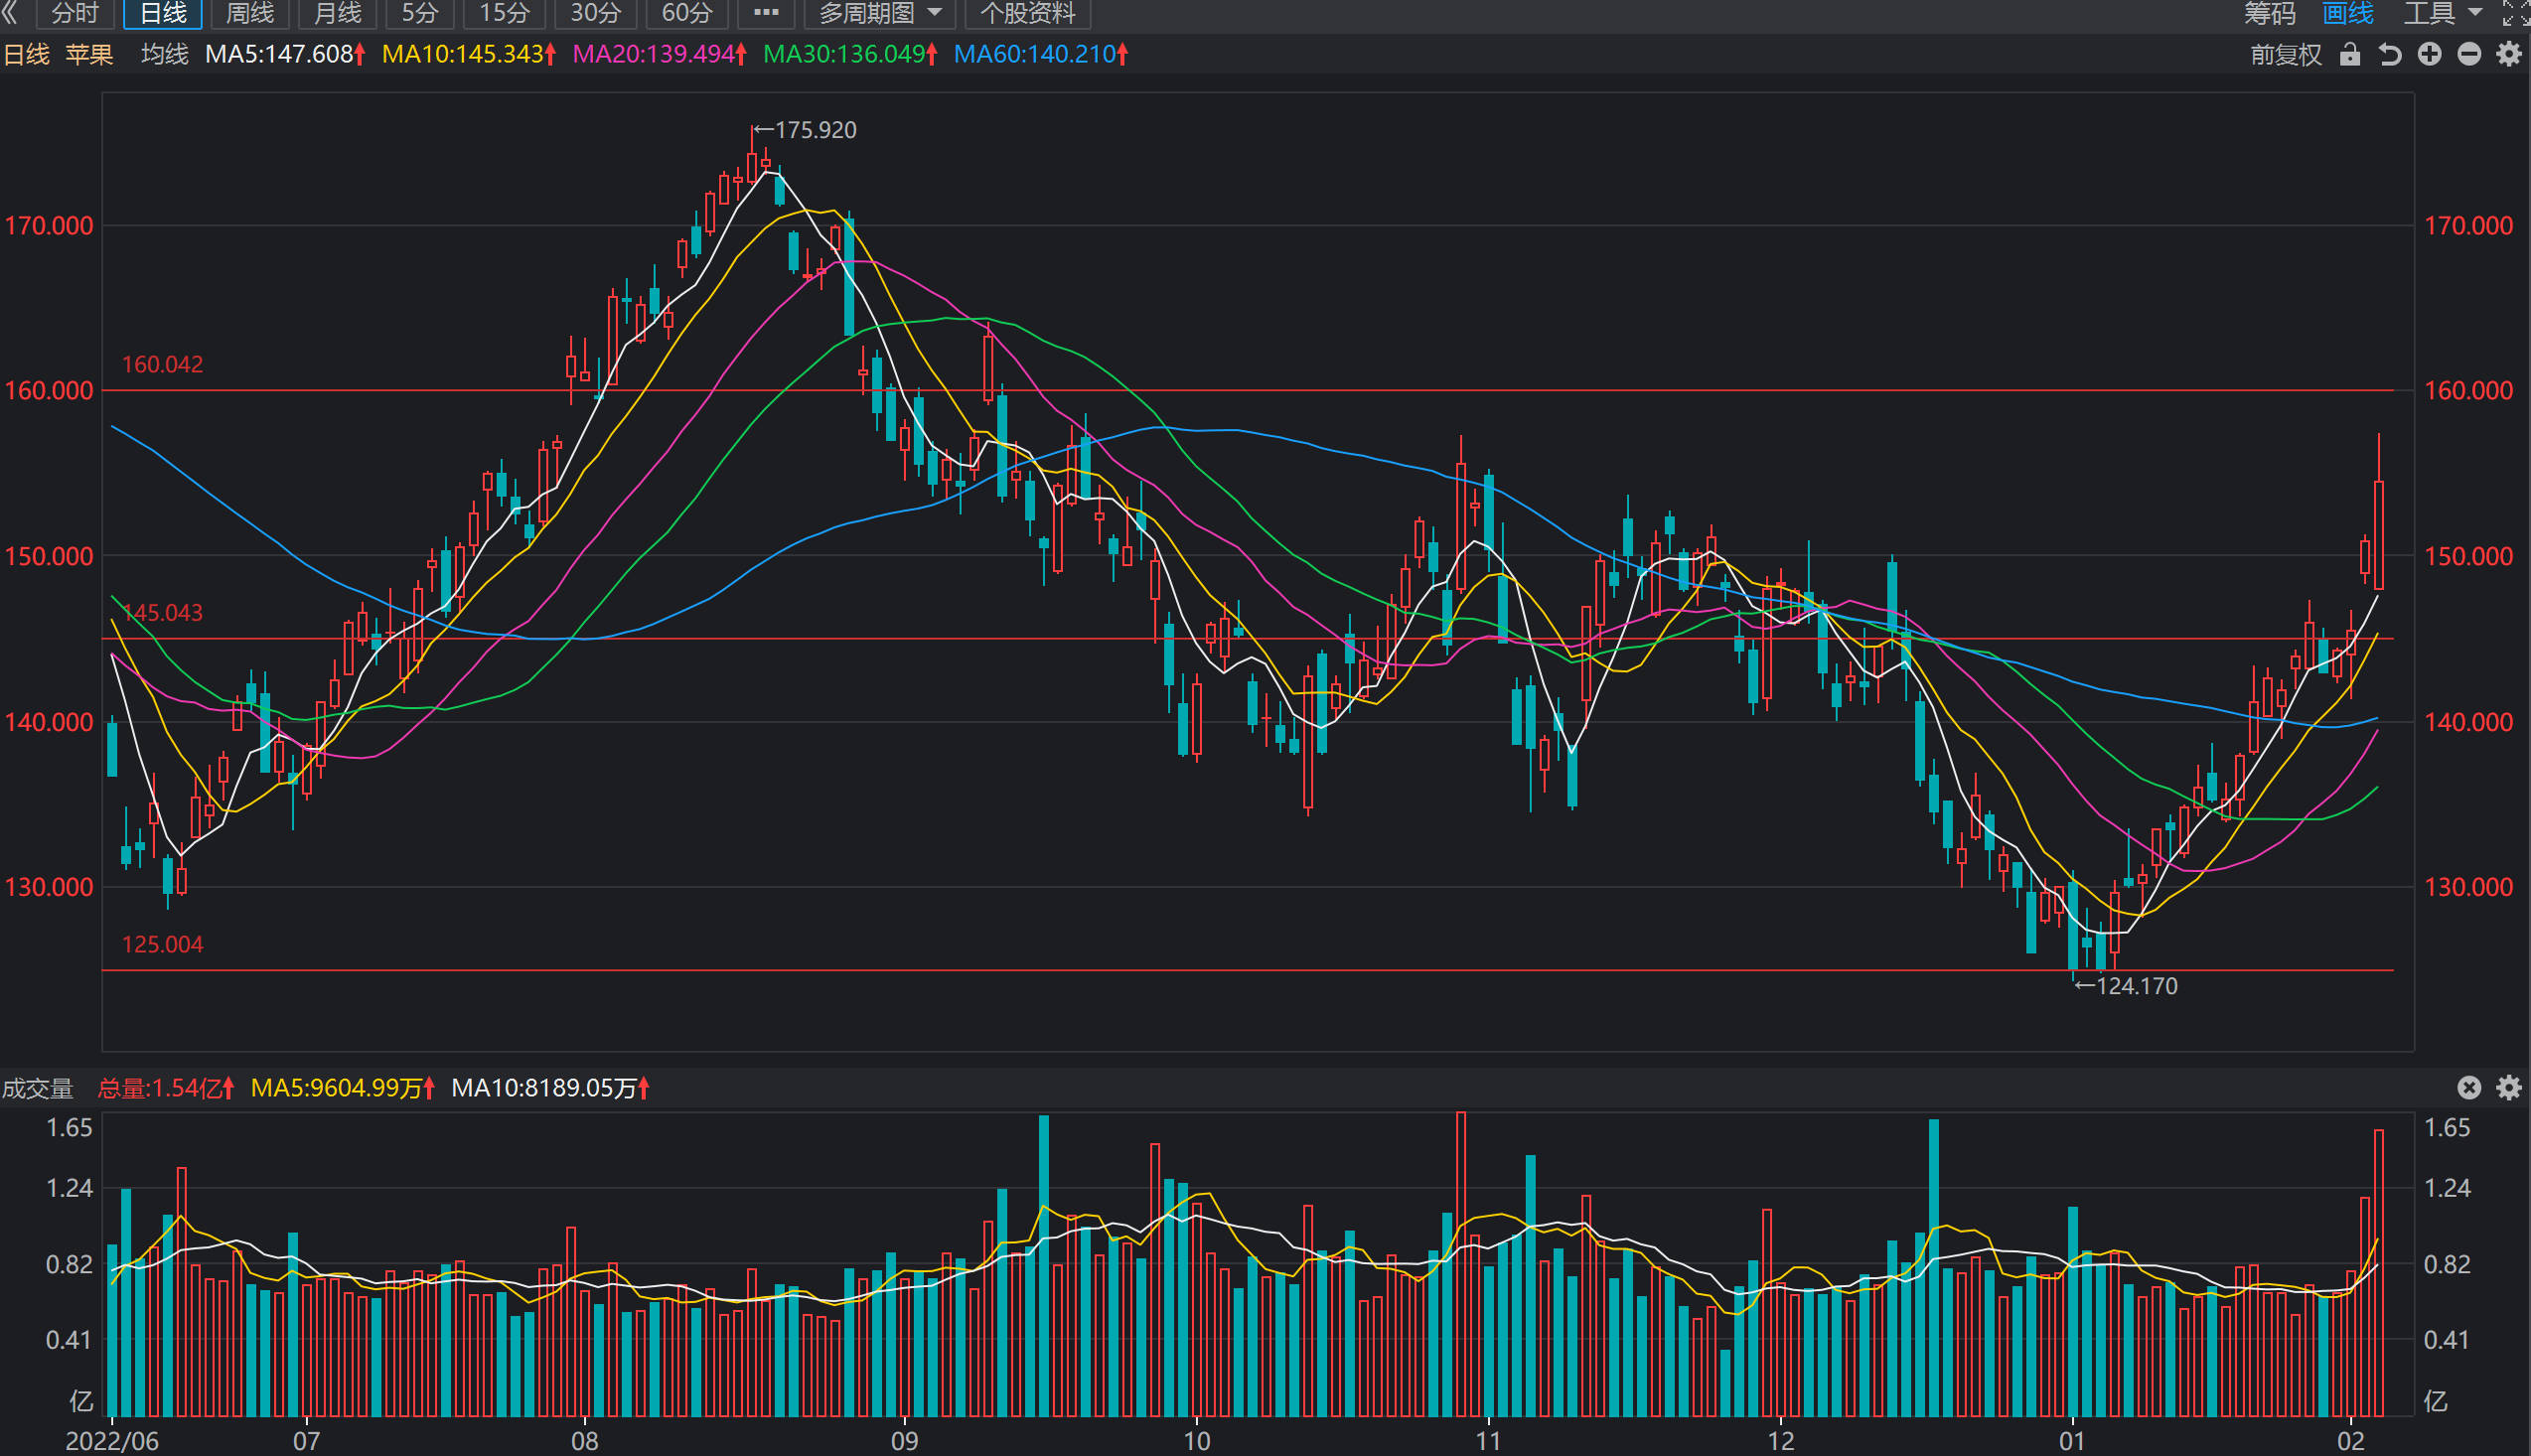
(Note: The upper red line in the picture is the resistance, and the lower red line is the support)
Analysis from stock chart
—————————————————————-
Short-term trend: bullish
Sell high and buy low of range : $145 – $160
Support: $145 resistance: $160 Stop Loss Price: $145 price target: $160 Buy the position again: stop fall and rise to $145
Medium-term trend: bullish
High sell low buy range: $140 – $160
Support: $140 resistance: $160 Stop Loss price: $140 price target: $160 Buy the position again: stop fall and rise to $140
Long-term trend: bullish
High sell low buy of range: $125 – $160
Support : $125 resistance: $160 Stop Loss price: none price target : $160 Buy the position again: stop fall and rise to $125
From Analysis from financial statements:
In Q1 2023, revenue of $117.154 billion, YoY-5.48%, net profit of $29.998 billion, YoY-13.38%, and EPS of $1.88. Q1 revenue fell for the first time since 2019, citing both supply chain impacts and demand concerns. The best buying price in the mid-term and long-term is recommended below $125. It is recommended that right-hand trading is the main strategy, the current valuation premium is obvious, but the repurchase force is large, and it is not advisable to be overly bearish.
Historical Forecast Record:
2023.1.6 From the stock chart analysis, the stock price of the last three transactions has not fallen below $124, and the short-term range remains between $125-$130, and the short-term trading high selling low buying yield is better. Short-term trading recommends selling high and buying low above $124, with a stop loss price of $124 and a target price of $135. Whether $124 is the medium-term and long-term lows cannot be determined. The probability of the stock price falling below $124 again is higher. From Analysis from financial statements, Q4 2022 achieved revenue of $90.146 billion, YoY+8.14%, net profit of $20.721 billion, YoY+0.83%, and EPS of $1.29. Quarterly dividend of $0.23 per share. R&D expenses were US$6.761 billion, YoY+17.13%. According to the summary of supply chain news, the risk of revenue decline is high. The medium-term and long-term recommended buying price is between $105-$115. The trading strategy recommendation is mainly based on stock technical analysis.
2023.1.3 From the stock price chart analysis, Nikkei reported that the supply chain cut lowered orders again, and the stock price continued to fall today, falling below $130 again, and the stock price has fallen below the previous support. Short-term trading has a lower chance of profitability, and it is not recommended to rebound until the stock price has rebounded above the 20-day moving average. At present, the short-term profit opportunity of long-term buying and holding in the stock price is low, and it is not recommended, and the medium-term and long-term profit opportunity is higher. Last time I predicted that the stock price was under significant long-term pressure, it was only a matter of time before it fell below $130, and the current stock price trend was confirmed.
From the stock chart analysis, the recent stock price fell below $130 again, $0.3 away from the previous lowest point of $128.43. The probability of the stock price choosing the direction of fluctuation is high, and if it falls below $128, it may start a downtrend at the mid-level level, and the downside target price is expected to be between $100 and $105. If it bounces upwards, the short-term target price is $145. Recently, the correlation between stock prices and the NASDAQ index is very high, and the focus is on whether the index breaks downward. Short-term bids are recommended above $130, with a stop price of $128 and a target price between $145 and $152. The mid-line bid price is $130, the stop price is $128, and the target price is between $150 and $155, and the overall trend of the stock price remains dominated by a large range of bands. The stock price is under obvious pressure in the long term, and it is only a matter of time before it falls below $130.
2022.11.07 From the technical chart, the stock price is in a downward trend for a long time, the middle line is in a large range of oscillation, the fluctuation range is between $130-$170, the short-term has signs of a downward break, it is recommended that short-term trading is backed by $135 high selling low absorption or Bo rebound, stop loss of $130, temporarily not covering back, as for medium-term trading, around $135 can first enter a small part of the position, after full adjustment and then increase the position. The stock price is under obvious pressure in the long term, and it is only a matter of time before it falls below $130.
2021.11.04From the technical chart, the stock price is at a high level from the medium and long-term perspective, and it is held long. In the short term, it has stood on the 60-day moving average, challenging the previous high at any time, focusing on the upper pressure levels of $160 and $165. From a fundamental point of view, according to the fourth quarter report of 2021, the company’s operating income continued to maintain a growth rate of 29%, with a net profit of 20.551 billion US dollars, an increase of 62% over last year.
2021.10.14 From the technical chart, the stock price has fallen below the 60-day moving average, it is recommended that the medium and long-term funds leave the market and wait and see, there is some support at $138 in the near future, and short-term trading can be fast-forward and fast out above $138. From a fundamental point of view, the company’s operating income continues to maintain a rapid growth rate, for such enterprises, it is not easy to say, and it is mostly held for a long time.
Key Quote Data:
52 Week Range: 124.17-178.79
P/E Ratio(TTM): 21.21
EPS(TTM): $6.1
Market Cap: $2060 B
Beta:1.24
Number of employees: 164000 historical data 147000
Summary of recent financial statements
February 2, 2023 announced financial results for its fiscal 2023 first quarter ended December 31, 2022. The Company posted quarterly revenue of $117.2 billion, down 5 percent year over year, and quarterly earnings per diluted share of $1.88.
In Q12023, revenue of $117.154 billion, YoY-5.48%, net profit of $29.998 billion, YoY-13.38%, and EPS of $1.88.
total net sales of $117.15 billion for the quarter ended Dec. 31, down from $123.95 billion in the prior-year period. Analysts polled by Capital IQ expected $121.65 billion.
Adjusted per-share earnings for the quarter fell to $1.88 from $2.10, under the Street’s view for $1.95.
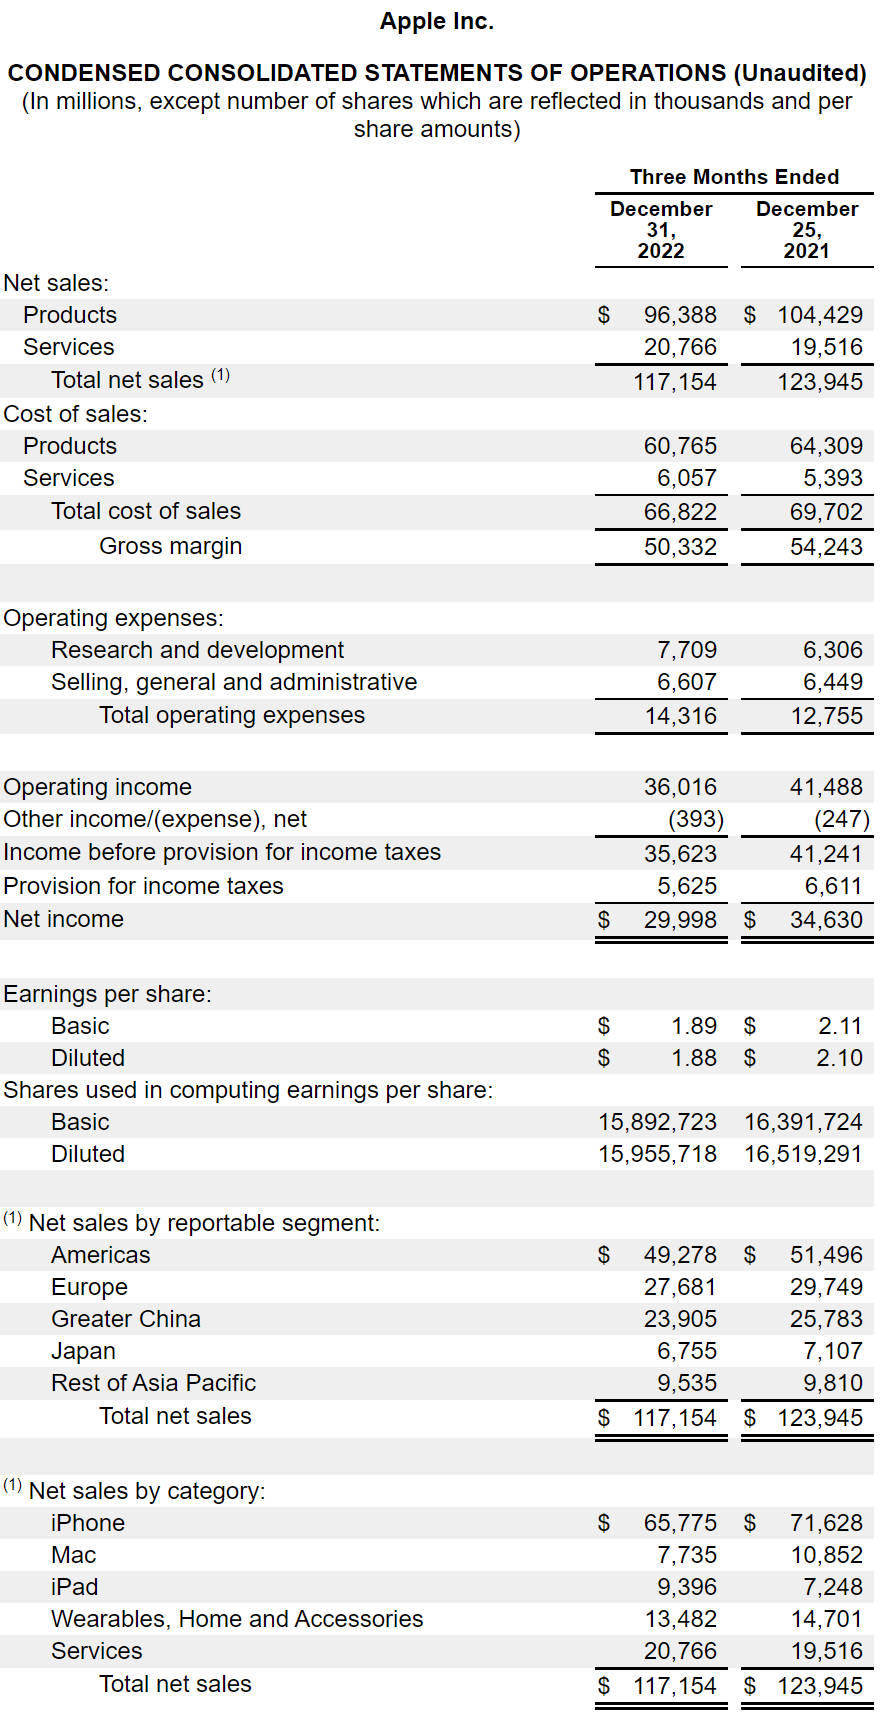
Apple Inc. CONDENSED CONSOLIDATED STATEMENTS OF OPERATIONS (Unaudited)
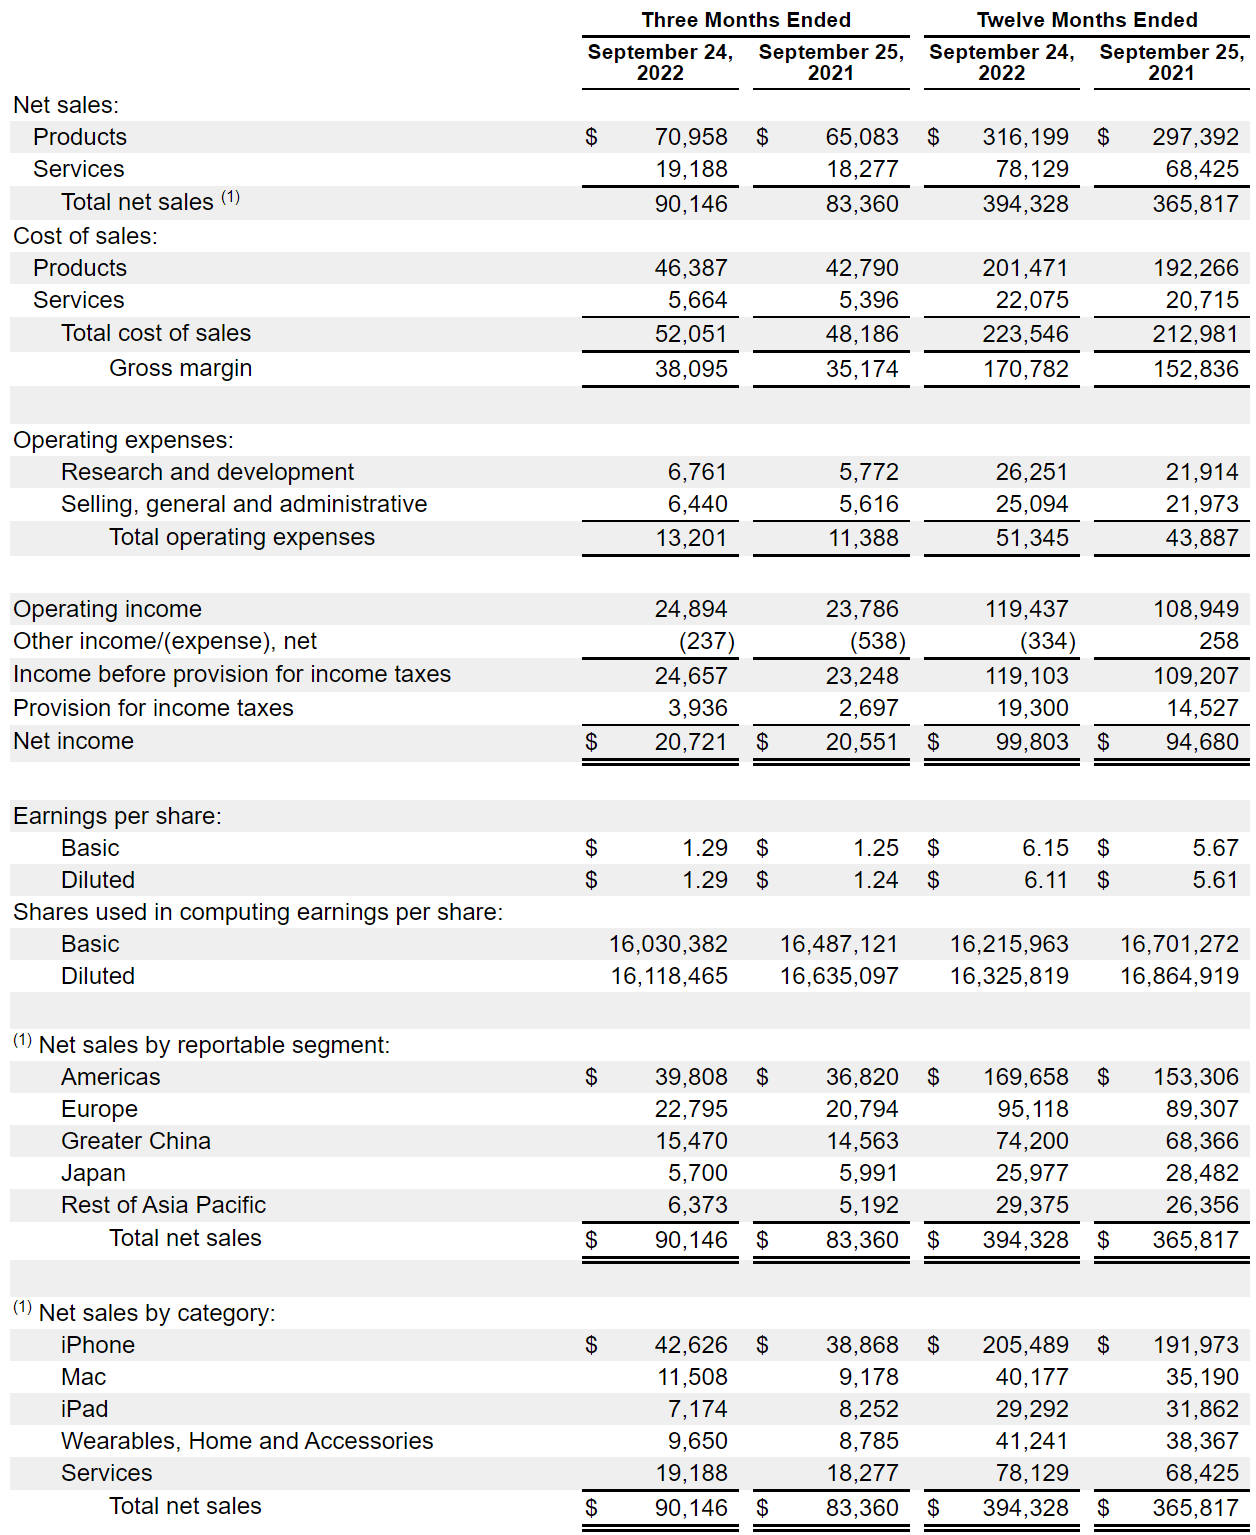
2022.10.26 In fiscal year 2022, Q4 achieved net sales of $90.146b, YoY+8.14%, net profit attributable to common shareholders of US$20.721 billion, YoY+0.83%, and EPS of US$1.29. Quarterly dividend of $0.23 per share. R&D expenses were US$6.761b, YoY+17.13%. FOURTH-QUARTER REVENUE WAS $90.15 BILLION, ESTIMATED AT $88.64 BILLION; FOURTH-QUARTER EARNINGS PER SHARE WERE $1.29, ESTIMATED $1.26; FOURTH-QUARTER IPAD REVENUE WAS $7.17 BILLION, ESTIMATED AT $7.81 BILLION; IPHONE REVENUE WAS FUSSY URL. $42.63 BILLION, ESTIMATED AT $42.67 BILLION; AND WEARABLES, HOME AND ACCESSORIES IN THE FOURTH QUARTER WAS $9.65 BILLION, ESTIMATED AT $8.8 BILLION. Q4 net profit was $20.721 billion, compared with market expectations of $20.526 billion. Q4 Greater China revenue was US$15.47 billion, up 6.2% year-over-year. As of the end of the fourth quarter of fiscal 2022, cash holdings and cash equivalents totaled $23.65 billion, down 32% year-over-year, and the market expected $27.63 billion.
About Apple Inc.
Apple revolutionized personal technology with the introduction of the Macintosh in 1984. Today, Apple leads the world in innovation with iPhone, iPad, Mac, Apple Watch, and Apple TV. Apple’s five software platforms — iOS, iPadOS, macOS, watchOS, and tvOS — provide seamless experiences across all Apple devices and empower people with breakthrough services including the App Store, Apple Music, Apple Pay, and iCloud. Apple’s more than 100,000 employees are dedicated to making the best products on earth, and to leaving the world better than we found it.