Lululemon Athletica Inc. (NASDAQ:LULU) Stock price trend forecast and trading range:
I personally sold my position at $334 and escaped today’s big decline.
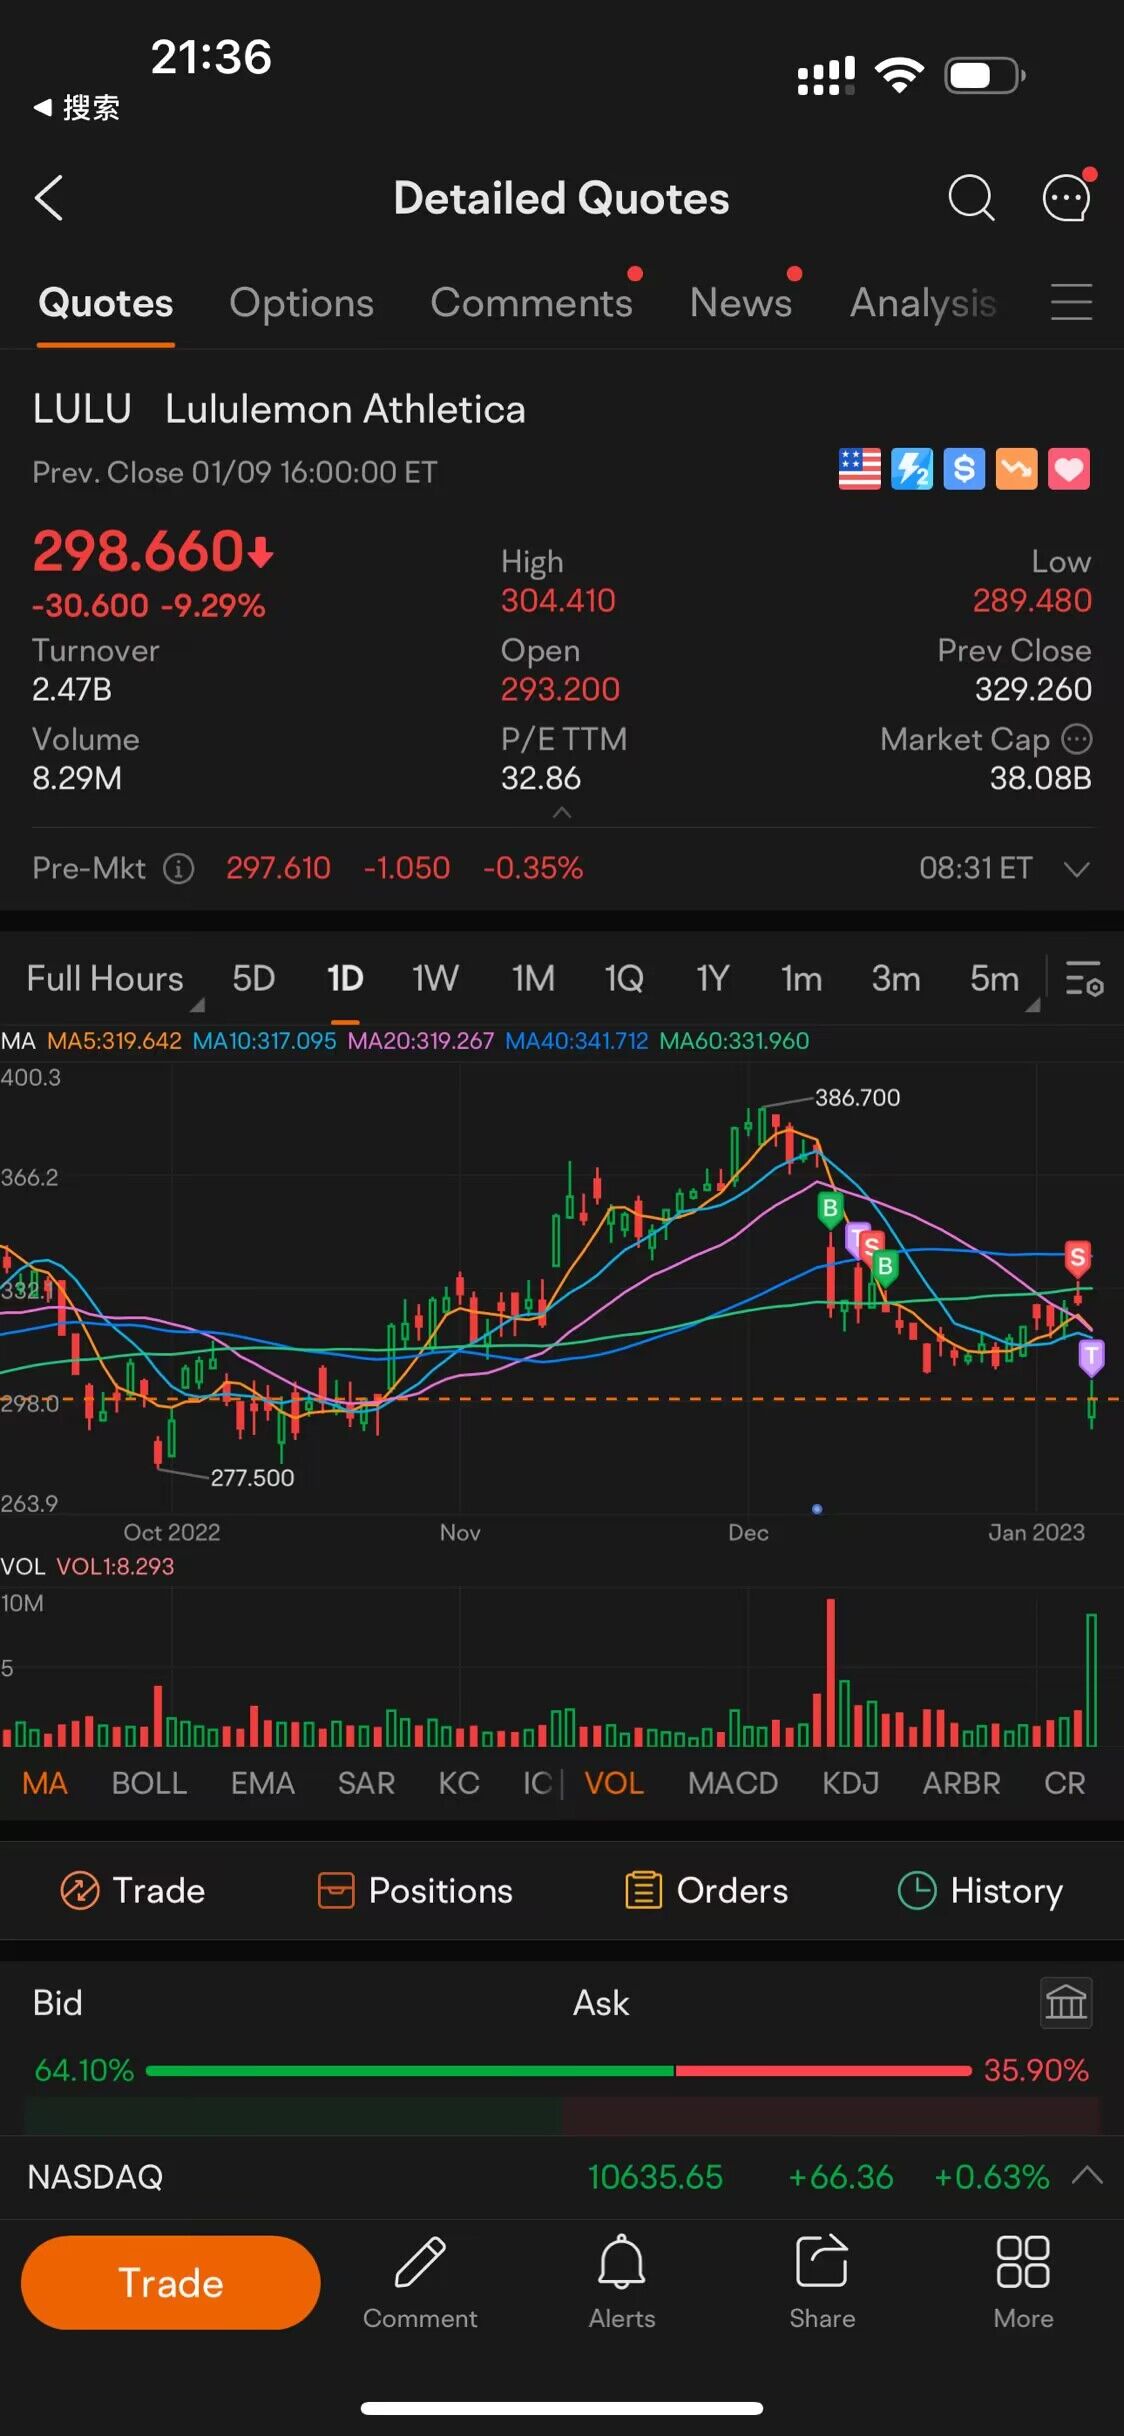
Updated to: 2023.1.9
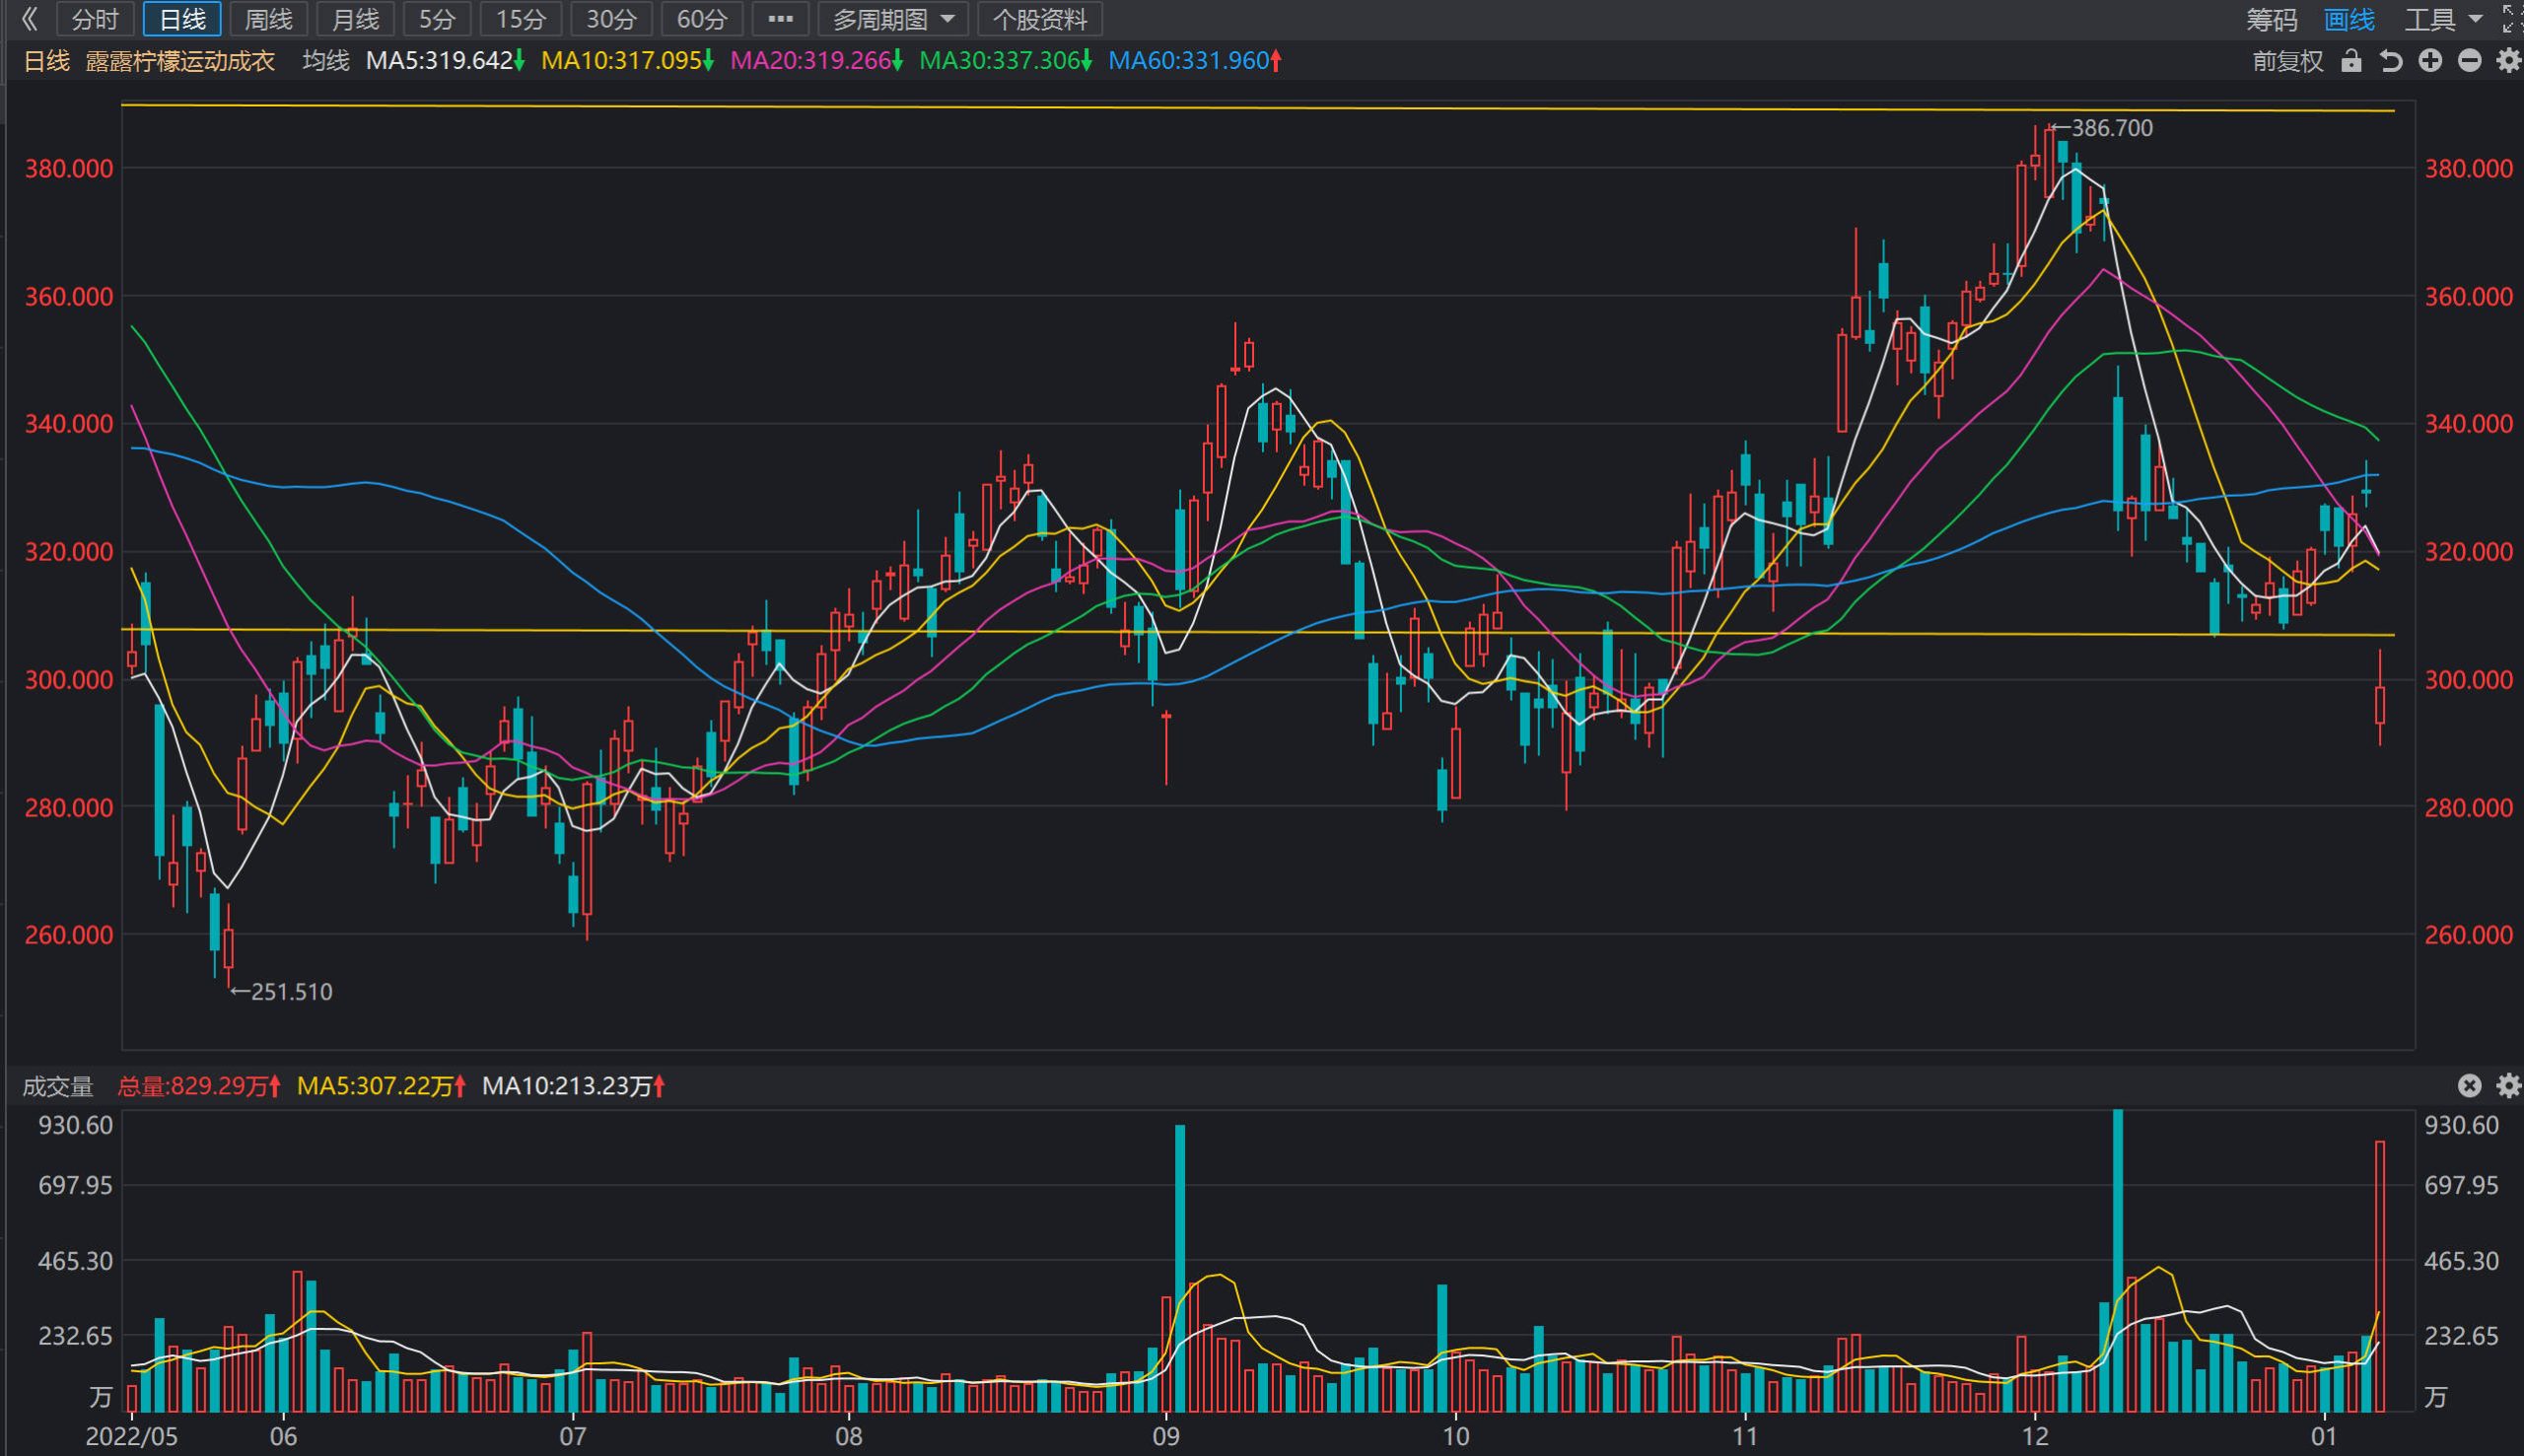
(Note: The upper red line in the picture is the resistance, and the lower red line is the support)
Analysis from stock chart
—————————————————————-
Short-term trend: down
Sell high and buy low of range : $285 – $300
Support: $280 resistance: $300 Stop Loss Price: $280 price target: $300 Buy the position again: stop fall and rise to $280
Medium-term trend: down
High sell low buy range: $285 – $300
Support: $280 resistance: $300 Stop Loss price: $280 price target: $300 Buy the position again: stop fall and rise to $280
Long-term trend: rebound
High sell low buy of range: $250 – $350
Support : $250 resistance: $350 Stop Loss price: $250 price target : $350 Buy the position again: stop fall
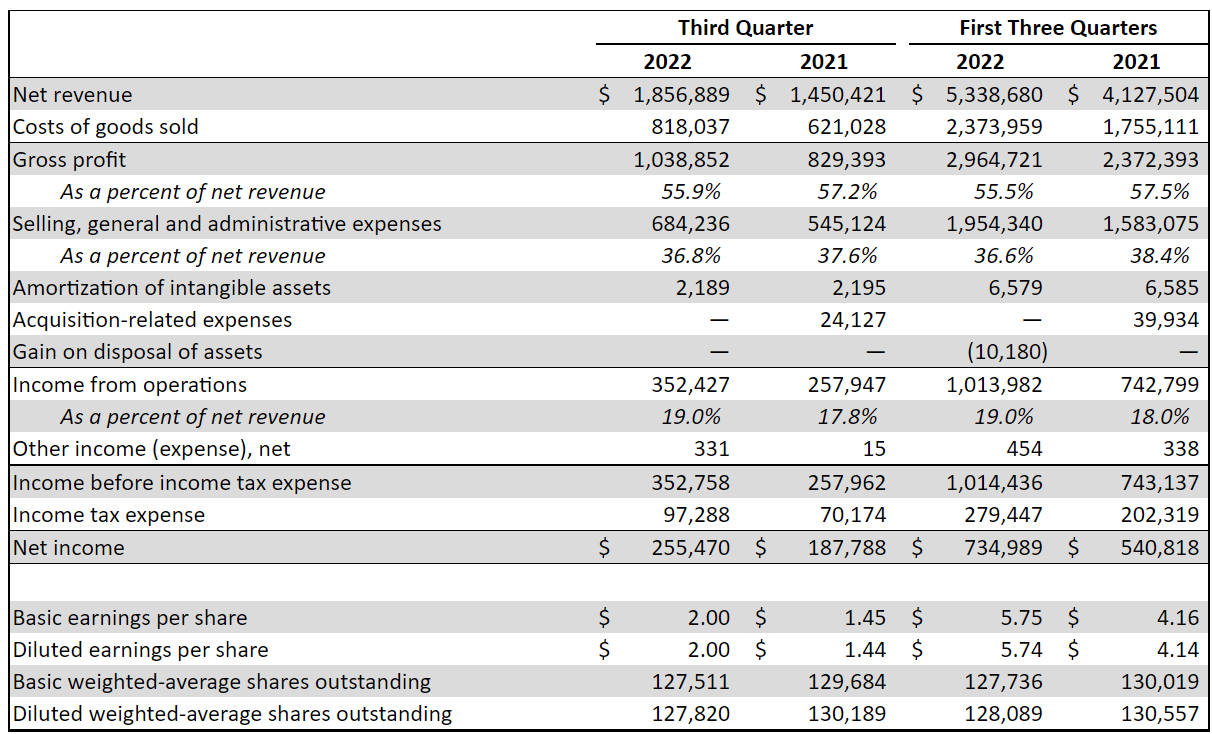
From Analysis from financial statements:
revenue for the third quarter of fiscal 2022 was $1.857 billion, market expectations were $1.82 billion, YoY+28.02%, net income attributable to common shareholders was $255 million, YoY+36.04%, EPS $2, YoY+38.89%, and market expectations were $1.97. Focus on the growth rate of revenue, inventory problems are not a big problem, stock price decline is only a short-term sentiment release, which has little impact on the medium-term and long-term trend. The stock price and net profit premium are higher, but the revenue growth is higher, the best medium-term and long-term holding stock price is $300, and the current stock price is aware of the risk of drawdown.
Historical Forecast Record:
2022.12.28 From the stock chart analysis, the recent stock price fell to $305, and the short-term remained in the range of $305-$320. The probability of choosing the direction of volatility in the near future is higher, with short-term bids above $305, stop-loss prices of $305, and price target of $320. If the stock price breaks upward, the probability of falling below $320 again will decrease, and it can be chased higher after effectively breaking through $320. If the stock price effectively falls below $305, the probability of testing $280 again will rise sharply, and it is recommended to leave the market and wait and see, but the probability of this trend is low. The long-term recommended buy price of $310 and hold, but there is little room for short-term profit.
2022.12.09 From the analysis of stock technical graphics, due to the weaker-than-expected financial report, the stock price plummeted short-term, falling below the 60-day moving average during the session. The stock price also fell below my recommended stop price, basically one step, short-term and medium-term trading can enter around $330, with a target price of $380.
2022.12.05 From the technical chart, the stock price is in the uptrend of the mid-line level, and you can make money by holding it. It is recommended that short-term and medium-term trading back to $360 high, sell low, suck or hold, stop loss price of $360, cover price can be when the stock price rises above the 20-day moving average. From a fundamental point of view, operating income for the second quarter of fiscal 2022 was US$1.868 billion, YoY+28.80%, net income attributable to common shareholders was US$290 million, YoY+39.14%, EPS was US$2.26, YoY+42.14%. The stock price has a large premium to the company’s performance, but the revenue growth rate is higher, and the ideal medium and long-term holding stock price is $300, and the current stock price pays attention to the risk of drawdown. Investors should pay attention to the risk of chasing higher and recommend presetting the stop loss price to $360.
2021-09-10 From the technical chart, the stock price continues to break through strongly, the trading volume is amplified simultaneously, the set of medium and long-term long positions above the 60-day moving average holding, short-term money trading can fall below the 10-day wireless after the long single out avoidance. From a fundamental point of view, there is a large premium between the stock price and the company’s performance, and investors should pay attention to the risk of chasing higher. When the stock price falls significantly, consider stop-loss trading.
2021.10.7 From the technical chart, the stock price continues to break through strongly after the volume is too large, the recent retracement to around $395, it is recommended to pay attention to the support of $390 below in the near future, if it falls below, the support of $370 below. There is no trend market, and the medium and long-term long term can temporarily leave the market and wait and see. Whether the stock price remains volatile at a high level will take more trading days to judge. From a fundamental point of view, there is a large premium between the stock price and the company’s performance, and investors should pay attention to the risk of chasing higher. When the stock price falls significantly, consider stop-loss trading.
Key Quote Data:
52 Week Range: 251.51-410.70
P/E Ratio(TTM): 33.97
EPS(TTM): $9.1
Market Cap: $41.84 B
Number of employees: 29000 historical data 25000
Summary of recent financial statements
2022.12.08 Revenue for the third quarter of fiscal 2022 was US$1.857 billion, market expected US$1.82 billion, YoY+28.02%, net income attributable to common shareholders was US$255 million, YoY+36.04%, EPS US$2, YoY +38.89%, market expectation was US$1.97. Full-year revenue is expected to be $7.94-7.99 billion, compared with $7.87-$7.94 billion, and fourth-quarter revenue is expected to be $2.61-$2.66 billion, compared with analysts’ expectations of $2.66 billion. (Note: The default is GAAP, Non-GAAP will be explained separately)
For the third quarter of 2022, compared to the third quarter of 2021:
Net revenue increased 28% to $1.9 billion, or increased 31% on a constant dollar basis. Net revenue increased 26% in North America, and increased 41% internationally.
Direct to consumer net revenue represented 41% of total net revenue compared to 40% for the third quarter of 2021.
Gross profit increased 25% to $1.0 billion and gross margin decreased 130 basis points to 55.9%.
Income from operations increased 37% to $352.4 million. Adjusted income from operations increased 25%.
Operating margin increased 120 basis points to 19.0%. Adjusted operating margin decreased 40 basis points.
The Company repurchased 54.6 thousand shares of its own common stock at an average price of $311.21 per share for a total cost of $17.0 million.
The Company opened 23 net new company-operated stores during the third quarter, ending with 623 stores.
Balance sheet highlights
The Company ended the third quarter of 2022 with $352.6 million in cash and cash equivalents and the capacity under its committed revolving credit facility was $394.8 million.
Inventories at the end of the third quarter of 2022 increased 85% to $1.7 billion compared to $0.9 billion at the end of the third quarter of 2021. On a unit basis inventory increased 80%, representing a three-year compound annual growth rate of 38%, which is inclusive of three-percentage points for in-transit inventories. The Company believes its inventories are well positioned to support its expected revenue growth in the fourth quarter.
2022 Outlook
For the fourth quarter of 2022, the Company expects net revenue to be in the range of $2.605 billion to $2.655 billion, representing a three-year compound annual growth rate of approximately 24%. Diluted earnings per share are expected to be in the range of $4.20 to $4.30 for the quarter.
For 2022, the Company expects net revenue to be in the range of $7.944 billion to $7.994 billion, representing a three-year compound annual growth rate of approximately 26%. Diluted earnings per share are expected to be in the range of $9.94 to $10.04 for the year and, excluding the gain on the sale of an administrative office building, adjusted diluted earnings per share are expected to be in the range of $9.87 to $9.97.
9/1/2023 update:for the fourth quarter of fiscal 2022, the Company now expects that net revenue will be in the range of $2.660 billion to $2.700 billion, representing a 25%-27% increase compared to the fourth quarter of fiscal 2021. The previous guidance range was $2.605 billion to $2.655 billion.
Diluted earnings per share are now expected to be in the range of $4.22 to $4.27 for the fourth quarter of fiscal 2022 compared to the Company’s previous guidance range of $4.20 to $4.30.
The Company also said it now expects gross margin for the fourth quarter of fiscal 2022 to decline 90-110 basis points compared to its previous expectation for an increase of 10-20 basis points. However, the Company now expects that it will further leverage selling, general and administrative expenses 100-120 basis points compared to its previous expectation of 30-50 basis points of leverage.
The revised guidance for the fourth quarter continues to assume an effective tax rate of approximately 28.5%.
About Lululemon Athletica Inc. (NASDAQ:LULU)
Lululemon athletica inc. (NASDAQ:LULU) is a technical athletic apparel, footwear, and accessories company for yoga, running, training, and most other activities, creating transformational products and experiences that build meaningful connections, unlocking greater possibility and wellbeing for all. Setting the bar in innovation of fabrics and functional designs, lululemon works with yogis and athletes in local communities around the world for continuous research and product feedback. For more information, visit lululemon.com.