Tesla, Inc. (Nasdaq: TSLA) stock Price target Trend Forecast and trading range Analysis:
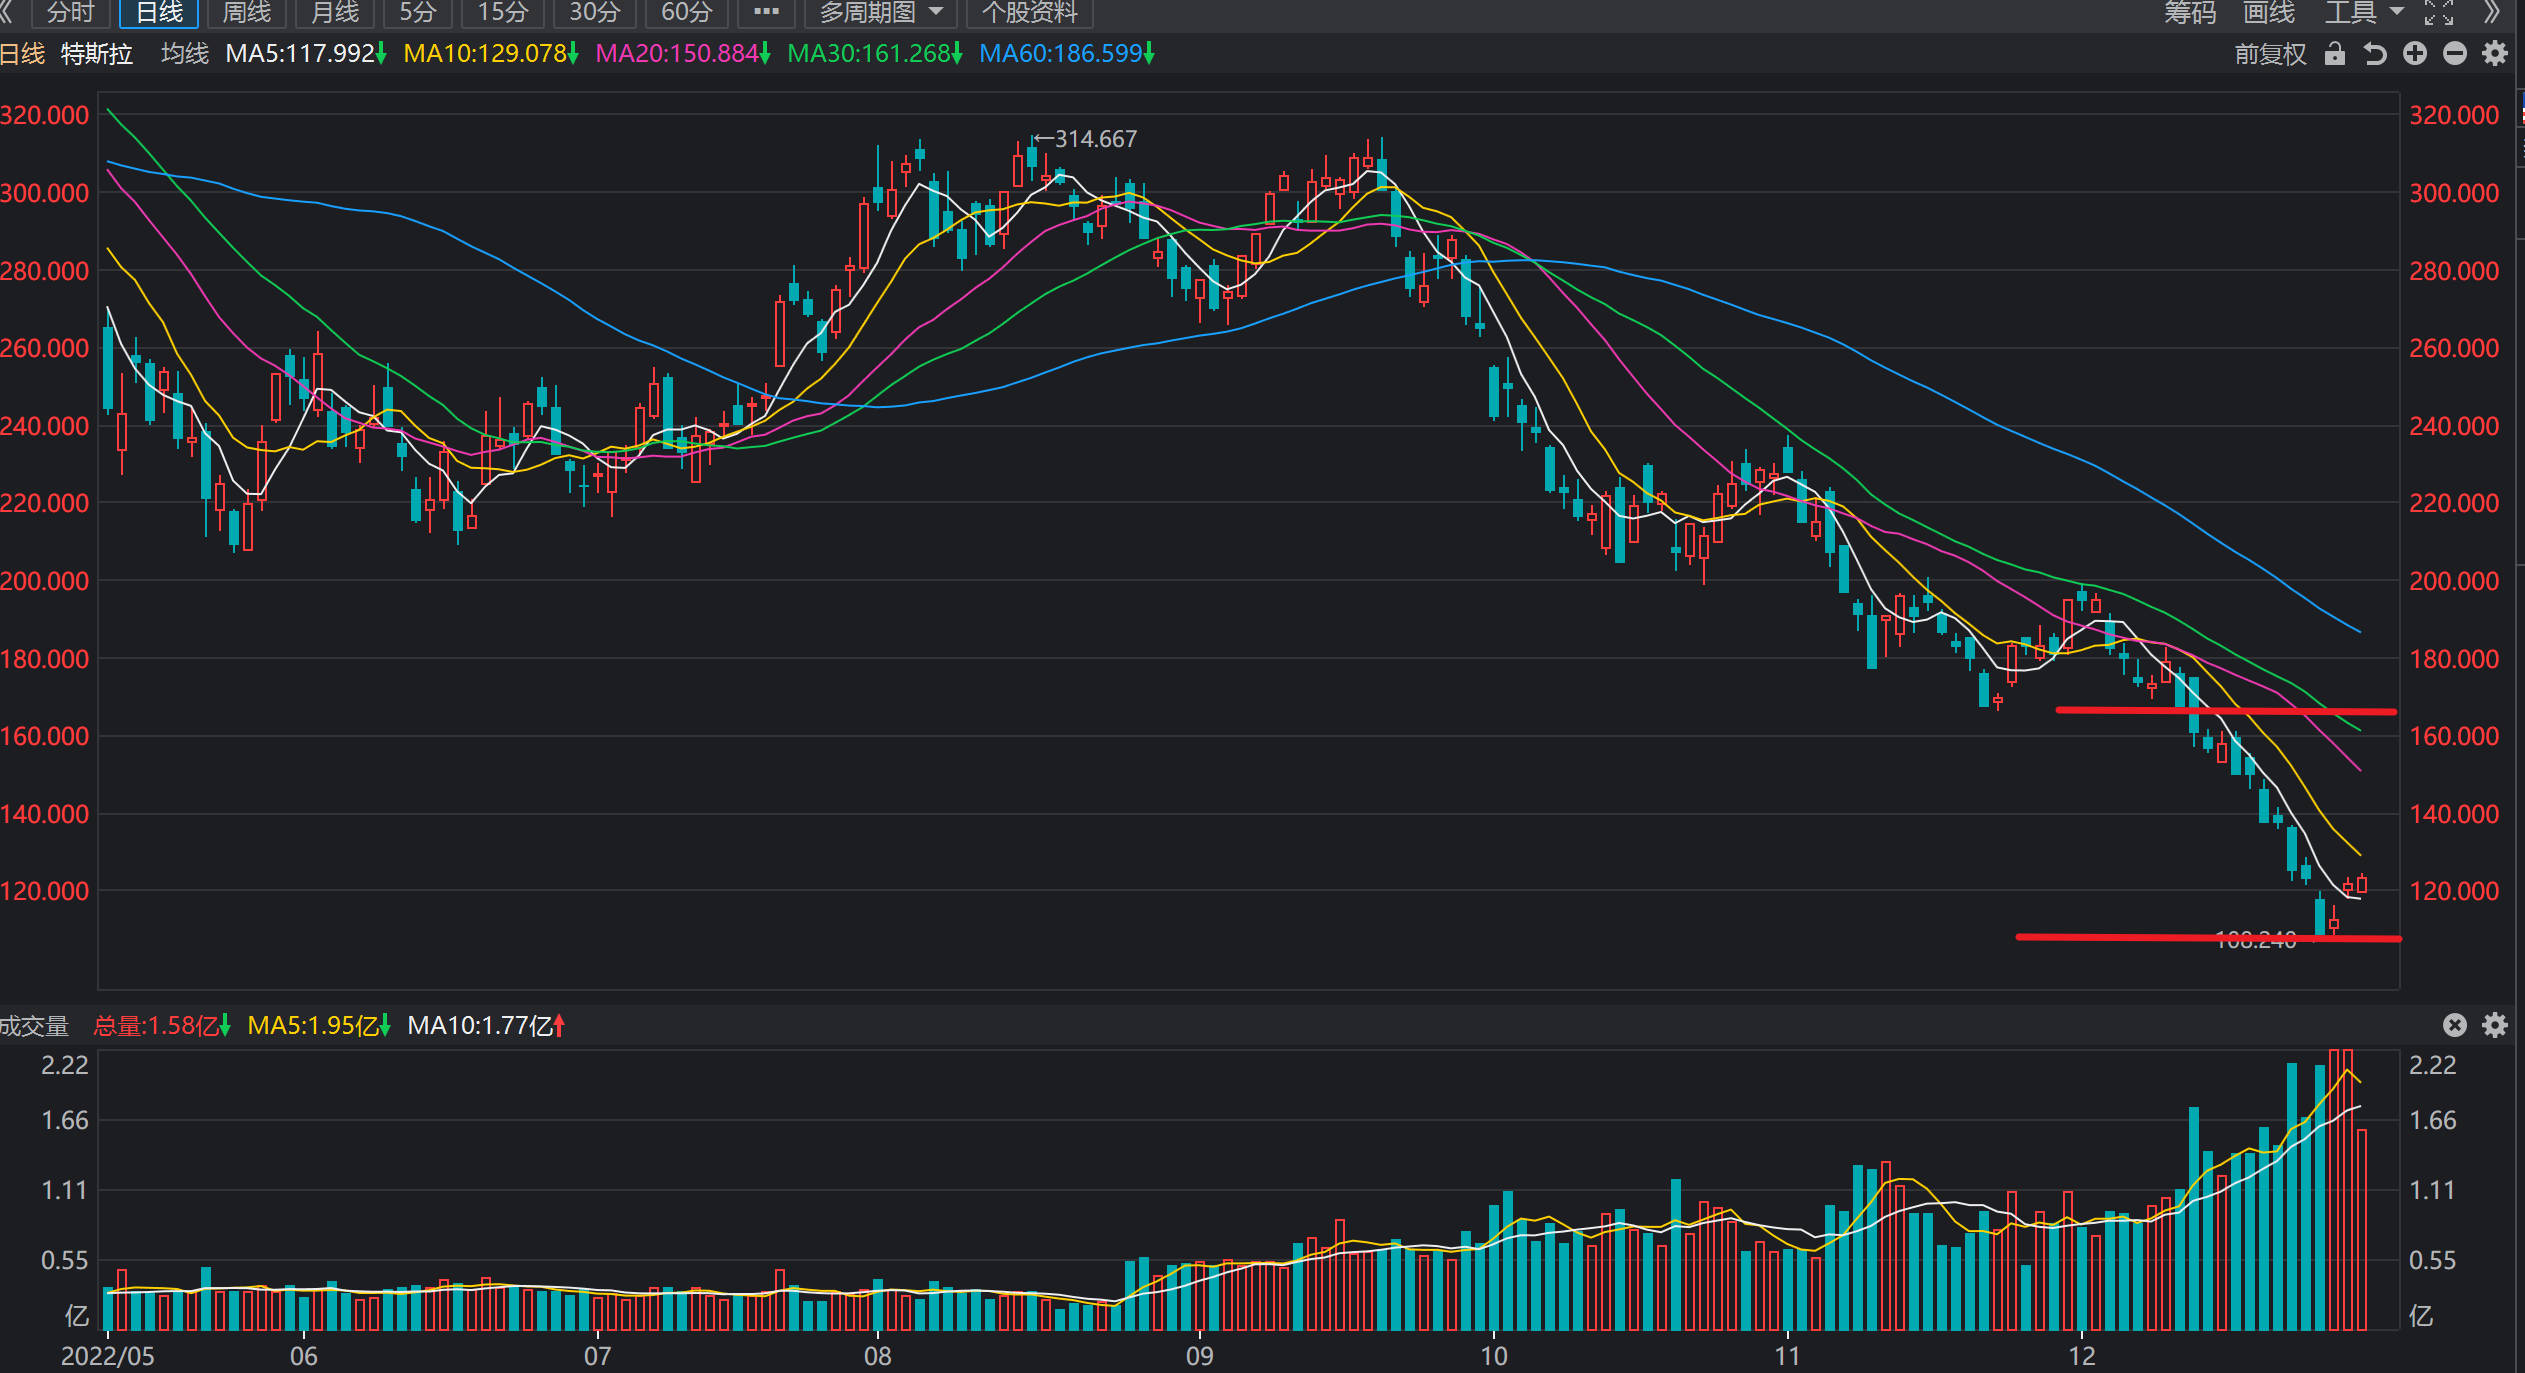
2022.12.30 From the stock price chart analysis, its support is $108,its resistance is $165.there is a well-established trading range between $108 and 140$,the stop-loss price is $106,the price target is $140,If the stock price bounces above $108, you can buy again,The trading strategy can be to sell high and buy low or to hold the shares until the share price reaches above the target price.if the stock price moves into below $108,next its resistance is $100 and its price maybe move into between $80 and $100.Hold stocks with a falling stock price trend cautiously. From Analysis from financial statements, Q3 2022 achieved revenue of US$21.454 billion, YoY+55.95%, net profit of US$3.292 billion, YoY +103.46%, and EPS of US$0.95. R&D expenses were US$667 million, YoY+15.8%. Faced with demand worries and rising interest rates,405,278 deliveries and 439,701 production in Q4 2022,net sales are under more pressure.It is recommended to trade using technical analysis and only keep the right side trade.
Historical Forecast Record:
2022.12.27 From the stock chart analysis, The previous I predicted that the stock price will break through the lower $166 again after the short-term rebound, approaching the $120-$140 line, today’s stock price hit a new low, there is no support below, it is recommended to focus on the buying power of $100. There has been too much negative news recently, and the medium and long term is under pressure. Although the stock price has fallen sharply recently, the opportunity to make a profit from the bottom is small, it is not recommended to hold, only recommend trading on the right, and I myself liquidated at $122.4. The medium to long term buying price is recommended to be $60-$80.
2022.12.22 From the stock technical chart analysis, in the previous issue I predicted that the stock price would break through the lower $166 again after the short-term rebound, approaching the $120-$140 line, the trend is basically not out of the forecast, today’s intraday low of $122.26. So will $120 be a short-term bottom? I think the probability of a phased bottom is high, and volume also supports the view of a short-term bottom. Tesla stock price may bottom before the NASDAQ index, the short-term trading range is between $120 and $150, the mid-term target price is $220, and the position is recommended to be up to 15%. From a fundamental point of view, Q3 2022 achieved operating income of US$21.454 billion, YoY +55.95%, net profit attributable to common shareholders of US$3.292 billion, YoY +103.46%, and EPS of US$0.95. R&D expenses were US$667 million, YoY+15.8%. Sales revenue continues to maintain rapid growth, no signs of slowdown for the time being, but delivery data relies on capacity, capacity release after the need to enter capital expenditure again to add new capacity, it is recommended to focus on monthly delivery data, medium and long-term valuation premium is obvious, not recommended to participate, short-term flexible operation, high selling and low absorption, it is recommended that only technical graphics are trading strategies.
2022.12.14 From the analysis of stock technical graphics, in the previous round, I predicted that the stock price would break through the lower $166 again after the short-term rebound, approaching the $120-$140 line. It is recommended that short-term trading only back $165 high sell low suck, stop loss price of $165. The last two trading days have effectively broken the level, once again open a new downside space, it is recommended that short-term, medium-term trading temporarily avoided, do not rush to the bottom, patiently wait for the formation of the short-term bottom before intervention, try to keep the right side of the transaction.
2022.12.09 From the stock technical chart analysis, the recent stock price fell below the previous low of $198 after opening the downward shock lower mode again, short-term at $168 there is support, but the upper pressure level of $198 temporary breakthrough may not be too high, once the breakthrough can see $220 high, out of the $165-$220 big shock range, but the possibility is not high. I predict that after the short-term rally, it will break through below $166 again, approaching the $120-$140 line. It is recommended that short-term trading only back $165 high sell low suck, stop loss price of $165. Medium and long-term trading is temporarily avoided.
2022.11.04 From the technical chart, the stock price is in a medium and long-term downtrend, and the short-term shock shows signs of ending, and the new downside signs of falling below $200 again are obvious. From the K-line pattern, there is no medium and long-term holding space for the time being, short-term trading can be backed by $200 high selling low, stop loss level of $200, trading range between $200-$230. Recommended position 15%.
2022.9.14 From the technical chart, the recent stock price is in a rebound trend, the first trading range of short-term trading is back to $280, high selling low or target price of $310, stop loss of $280. The second trading range is back $268, stop loss at $268, and target price of $300. The middle line is backed by $280, the stop loss is $280, if it falls below you can stop the loss first, change it to around $265, the stop loss is $260. I can’t see the long-term space for the time being. Recommended position 15%. From a fundamental point of view, Q2 2022 achieved operating income of US$16.934 billion, YoY+41.61%, net profit attributable to common shareholders of US$2.256 billion, YoY +97.55%, and EPS of US$0.65. R&D expenses were US$667 million, YoY+15.8%. At present, the valuation premium is obvious, and the long-term holding pressure is greater, it is recommended to use technical graphics as a trading strategy as much as possible.
2021.12.17 From the technical chart, the stock price opened high and low, the volume fell 5.03%, the bulls did not have any intention of resistance, has fallen below the 60-day moving average, into a technical bear market, whether to go up or down, it is recommended to take $900 as the watershed collar, only above $900 to do a long rebound, below $900 can stop loss. Also, if the short-term Bo rally is recommended at $900, $850, $800 and other integer positions. From a fundamental point of view, the stock price rise is too large, it can be understood as a normal drawdown, the company is in rapid development, net profit is not the only standard to measure the stock price, it is recommended to focus on delivery volume and operating income growth. Bearish is expensive, you can not participate, but do not go short.
2021.12.16 From the technical chart, the stock price has fallen below the 60-day moving average, entering a technical bear market, whether to go up or down, it is recommended to take $900 as the watershed collar, only above $900 to do a long rebound, below $900 can stop loss. Also, if the short-term Bo rally is recommended at $900, $850, $800 and other integer positions. From a fundamental point of view, the stock price rise is too large, it can be understood as a normal drawdown, the company is in rapid development, net profit is not the only standard to measure the stock price, it is recommended to focus on delivery volume and operating income growth.
2021.11.06 From the technical chart, the stock price is in an uptrend, and the long position continues to hold. It is recommended that short-term trading be held above the 20-day moving average, and medium and long-term positions above the 60-day moving average, the possibility of further strengthening is extremely high, and if it breaks through 1200 yuan, it may challenge a new record high. The order of appearance is reversed, short-term trading stock prices fell below the 20-day moving average and turned short, and medium and long-term trading fell below the 60-day moving average to turn short. From a fundamental point of view, although the stock price is more expensive, but the logic of rapid growth exists, the price of bears is very large, you can not participate, but do not short.
2021.11.02 From the technical chart, the stock price is in an uptrend, and the long position continues to hold. It is recommended that short-term trading be held above the 20-day moving average, and medium and long-term positions above the 60-day moving average, the possibility of further strengthening is extremely high, and if it breaks through 1200 yuan, it may challenge a new record high. The order of appearance is reversed, short-term trading stock prices fell below the 20-day moving average and turned short, and medium and long-term trading fell below the 60-day moving average to turn short. From a fundamental point of view, although the stock price is more expensive, but the logic of rapid growth exists, the price of bears is very large, you can not participate, but do not short.
2021.10.26 From the technical chart, the stock price is in an uptrend, once exceeded $1,000 during the session, and the long position continued to hold. It is recommended that short-term trading be held long above the 20-day moving average, and medium and long-term long term above the 60-day moving average, the possibility of further strengthening is extremely high, and if it breaks through 900 yuan, it may challenge a new historical high. The order of appearance is reversed, short-term trading stock prices fell below the 20-day moving average and turned short, and medium and long-term trading fell below the 60-day moving average to turn short. From a fundamental point of view, although the stock price is more expensive, but the logic of rapid growth exists, the price of bears is very large, you can not participate, but do not short.
2021.10.22 From the technical chart, the stock price is in an uptrend, once exceeded $900 during the session, and the long position continued to hold. It is recommended that short-term trading be held long above the 20-day moving average, and medium and long-term long term above the 60-day moving average, the possibility of further strengthening is extremely high, and if it breaks through 900 yuan, it may challenge a new historical high. The order of appearance is reversed, short-term trading stock prices fell below the 20-day moving average and turned short, and medium and long-term trading fell below the 60-day moving average to turn short. From a fundamental point of view, although the stock price is more expensive, but the logic of rapid growth exists, the price of bears is very large, you can not participate, but do not short.
Key Quote Data:
52 Week Range: 108.24-384.28
P/E Ratio(TTM): 38.1
EPS(TTM): $3.25
Market Cap: $388.97 B
Numbers of employees: 99290 Historical data: 70757
Summary of recent financial statements
3/1/2023 Tesla reports 405,278 deliveries and 439,701 production in Q4 2022.
About Tesla, Inc.(NASDAQ:TSLA)
Tesla, Inc. designs, develops, manufactures, sells and leases fully electric vehicles and energy generation and storage systems, and offer services related to its products.Its automotive products include Model 3, Model Y, Model S and Model X. Powerwall and Megapack are its lithium-ion battery energy storage products.