Applied Materials, Inc. (NASDAQ:AMAT) Stock Price Trend Forecast and Market Analysis:
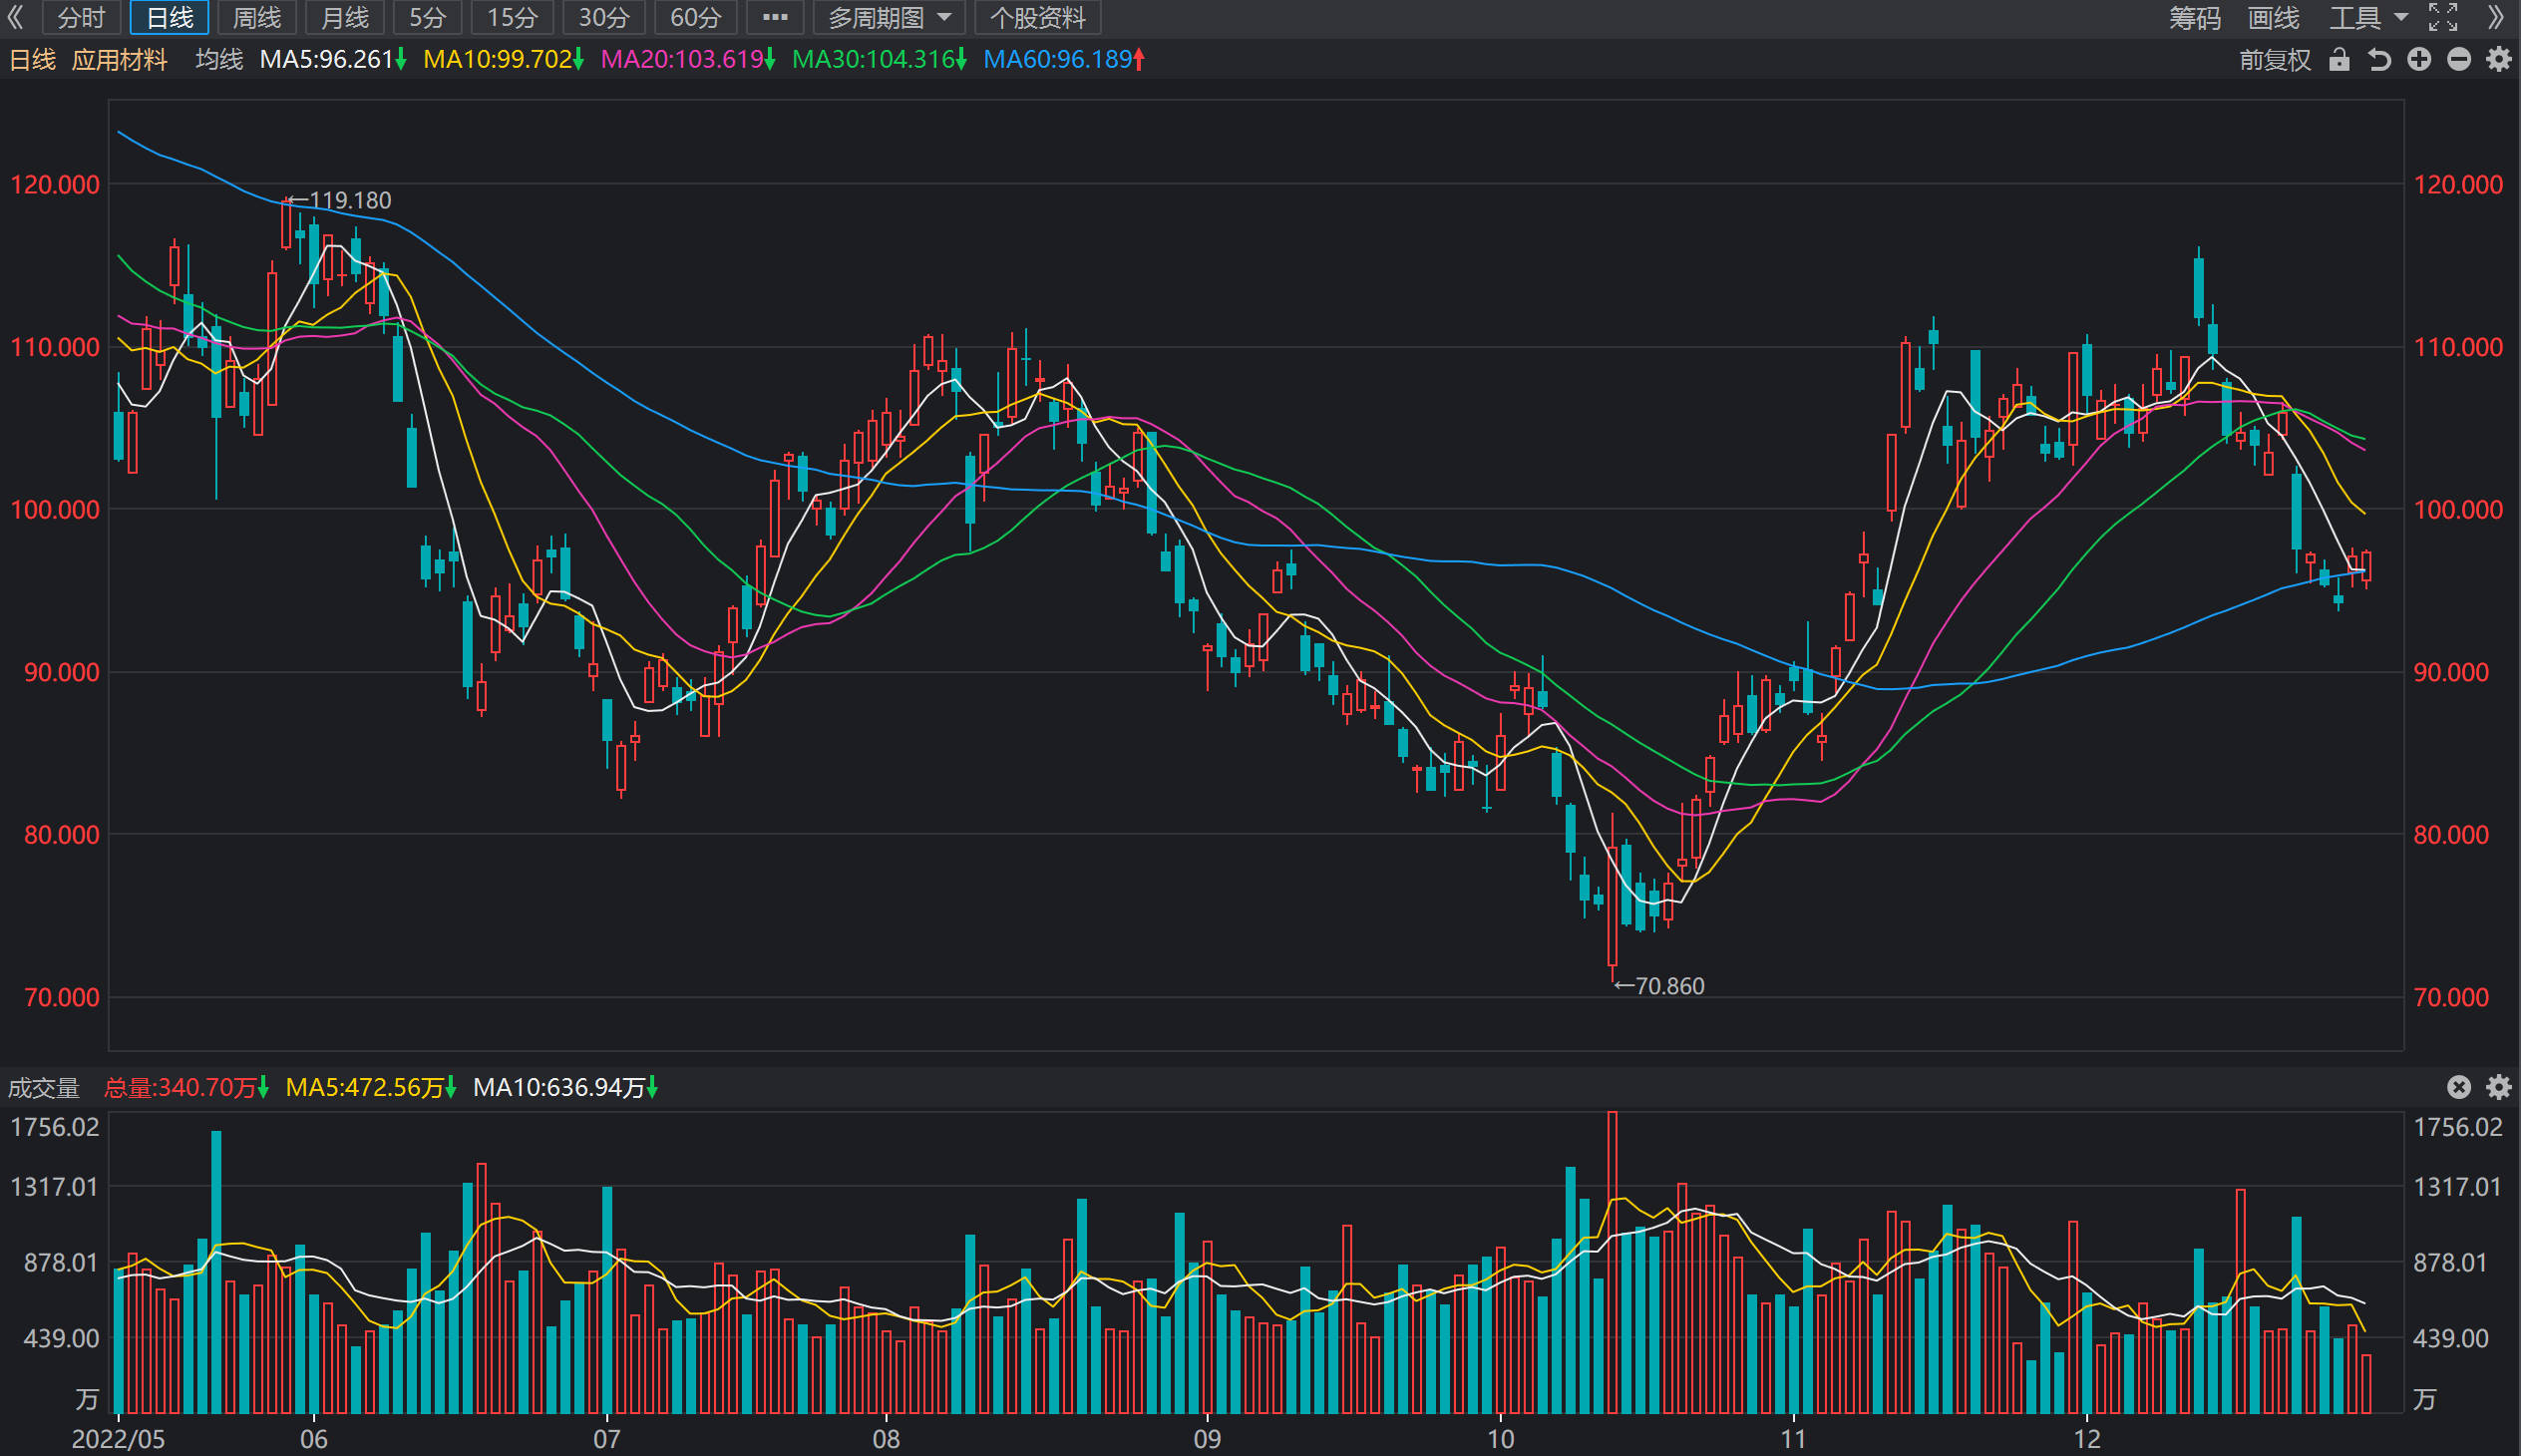
2022.12.30 From the stock chart analysis, the recent stock price fell from the rebound high point to the 60-day moving average, the short-term stock price has a high probability of fluctuation between $93-$100, the medium-term trend is uncertain, and the long-term trend depends on the index performance. The short-term bid price is recommended to be $94, the target price is $98, the stop loss price is $92, and the repeat sell high and buy low many times unless the short-term trend ends. Under the condition of declining industry demand, stock price performance relies on financial statements and indices, and it is recommended to trade in range-bound logic in the short term. From the analysis of financial statements, Q4 2022 achieved revenue of 6.749 billion US dollars, market estimate of 6.449 billion US dollars, YoY+10%, net profit of 1.591 billion US dollars, market estimate of 1.566 billion US dollars, YoY-7%, EPS 1.85 US dollars, YoY-2%, market estimate of 1.75 US dollars. Quarterly dividend of $0.26 per share. Q4 revenue continues to grow, the probability of continuing to remain stable in fiscal 2023 is high, it is recommended to control the medium and long-term buying point at about $80, the current stock price valuation premium is more, the trend of the stock price depends on the index performance, it is expected that the semiconductor industry demand impact fluctuation is smaller than the average of chip stocks and other industries.
Historical Forecast Record:
2022.11.17 From the technical chart, the recent stock price continued to rebound, once again came to the upper band of the range around $110, from the K-line pattern, short-term and medium-term need to preset stop loss, recommended stop loss level of $100, can rise to above $100 and then make up. The short-term recommendation is to sell high and sell low above $100, and the mid-term is backed by $100 to hold the position. Once it falls below $100, the probability of the stock falling back to the $75-80 line again will rise sharply, and it is recommended to move the trading range down to between $75-$95.
Key Quote Data:
52 Week Range: 71.12-167.06
P/E Ratio(TTM): 13.07
EPS(TTM): $7.44
Market Cap: $82.20 B
Number of employees: 33000 historical data 27000
Summary of recent financial statements
2022.11.17 Q4 2022 achieved revenue of US$6.749 billion, market estimate of US$6.449 billion, YoY + 10%, net profit of US$1.591 billion, market estimate of US$1.566 billion, YoY-7%, EPS US$1.85, YoY-2%, market estimate of US$1.75. Quarterly dividend of $0.26 per share.
Fourth Quarter Results
Applied generated revenue of $6.75 billion. On a GAAP basis, the company achieved gross margin of 45.9 percent, operating income of $1.99 billion or 29.5 percent of net sales, and earnings per share (EPS) of $1.85.
On a non-GAAP adjusted basis, the company reported gross margin of 46.0 percent, operating income of $2.01 billion or 29.8 percent of net sales, and EPS of $2.03.
The company generated $857 million in cash from operations and returned $1.72 billion to shareholders including $1.50 billion in share repurchases and $223 million in dividends.
Full Year Results
In fiscal 2022, Applied generated revenue of $25.79 billion. On a GAAP basis, the company recorded gross margin of 46.5 percent, operating income of $7.79 billion or 30.2 percent of net sales, and EPS of $7.44.
On a non-GAAP adjusted basis, the company reported gross margin of 46.6 percent, operating income of $7.86 billion or 30.5 percent of net sales, and EPS of $7.70.
The company generated $5.40 billion in cash from operations and returned $6.98 billion to shareholders including $6.10 billion in share repurchases and $873 million in dividends.
Business Outlook
In the first quarter of fiscal 2023, Applied expects net sales to be approximately $6.70 billion, The market expected $6.34 billion,plus or minus $400 million, which includes the expected impact of recently announced U.S. export regulations and ongoing supply chain challenges. Non-GAAP adjusted diluted EPS is expected to be in the range of $1.75 to $2.11.The market expected $1.79.
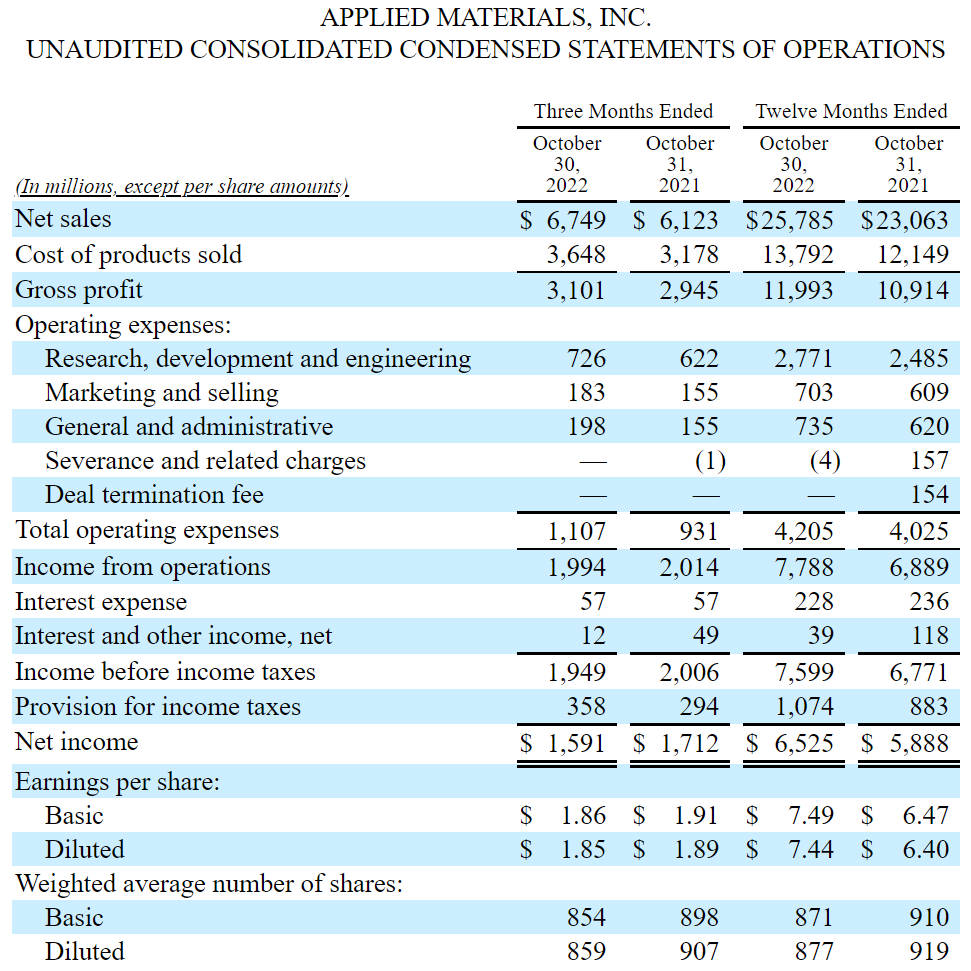
APPLIED MATERIALS, INC. UNAUDITED CONSOLIDATED CONDENSED STATEMENTS OF OPERATIONS
About Applied Materials, Inc. (NASDAQ:AMAT)
Applied Materials, Inc. (Nasdaq: AMAT) is the leader in materials engineering solutions used to produce virtually every new chip and advanced display in the world. Our expertise in modifying materials at atomic levels and on an industrial scale enables customers to transform possibilities into reality. At Applied Materials, our innovations make possible a better future. Learn more at www.appliedmaterials.com.