Estée Lauder (NYSE:EL) Stock Price Trend Forecast and Market Analysis:
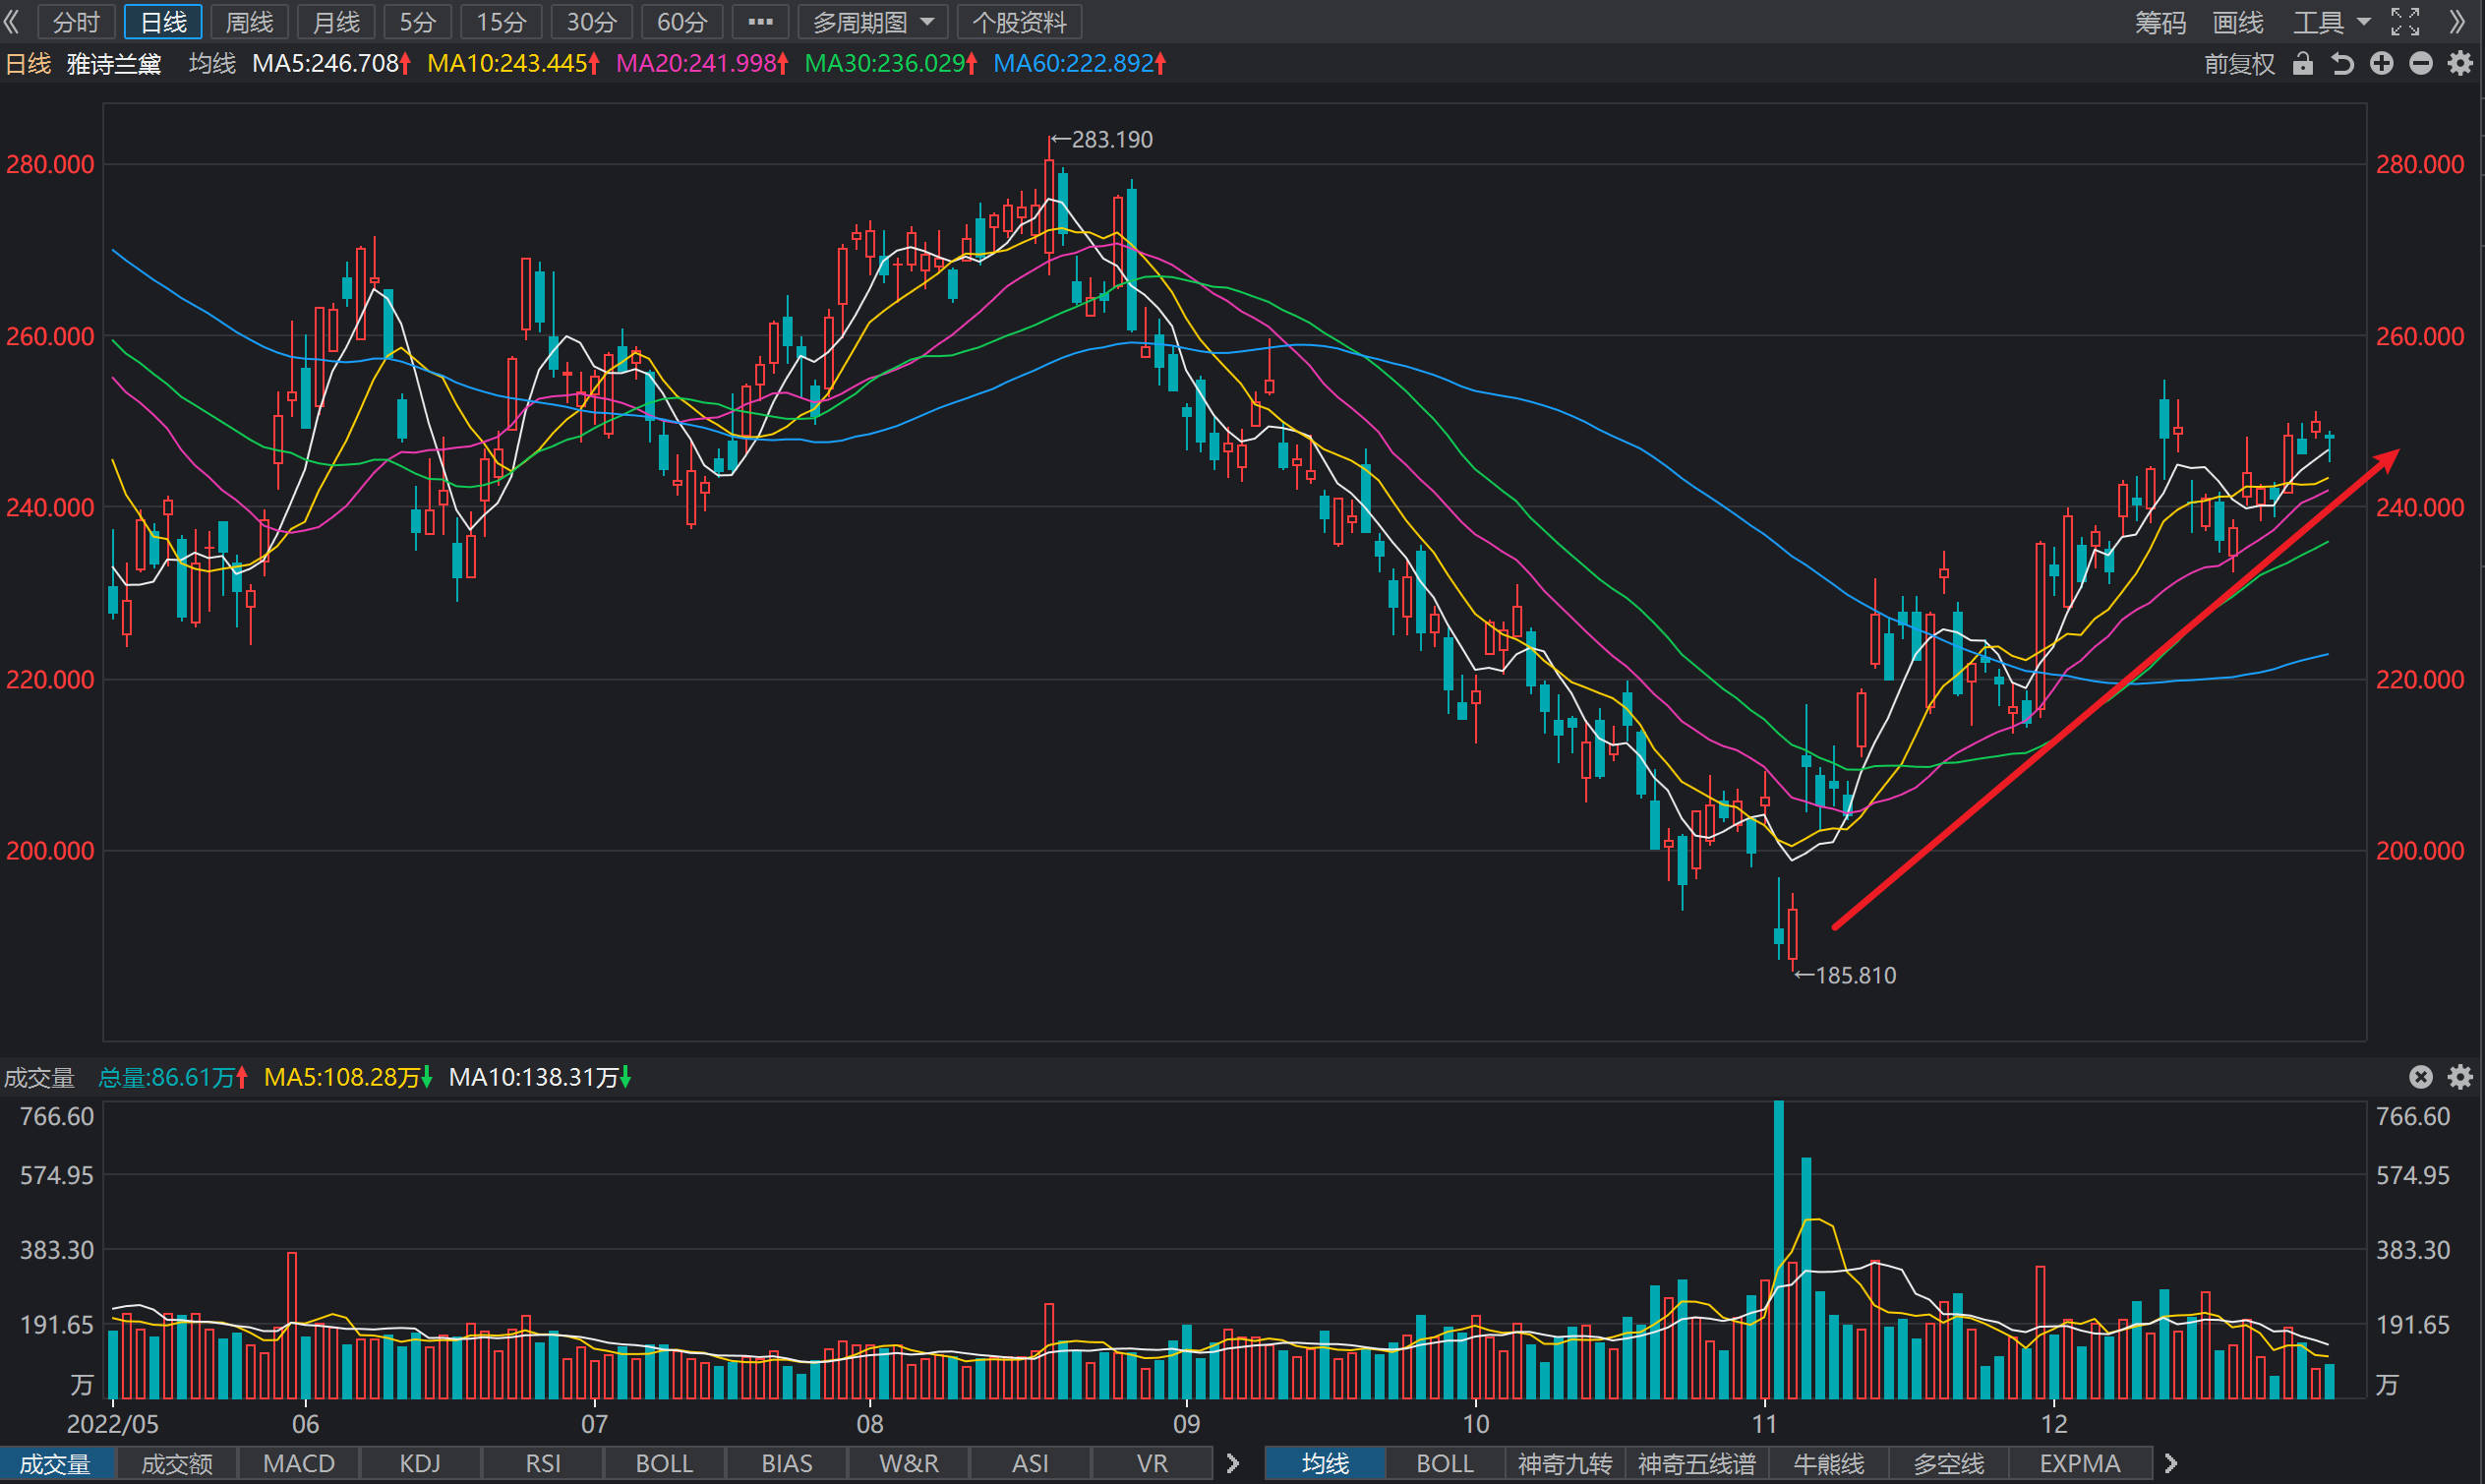
2022.12.30 From the stock chart analysis, the recent stock price has rebounded 30% from the previous low. The current stock price remains above the 20-day moving average, and the probability of breaking above $255 upwards and challenging $280 is unlikely. There is a higher probability that the stock price will fall to the 60-day moving average again. Short-term trading recommends holding above the 20-day moving average or selling high and buying low, with the stop loss price closing below the 20-day moving average and the target price between $250 and $280. For the current stock price and trend, the medium-term and long-term holding profit opportunities are relatively small, depending on the performance of the relevant index, it is recommended to trade only short-term transactions. From the analysis of financial statements, Revenue for the first quarter of fiscal 2023 was $3.93 billion, market estimate was $3.97 billion, YoY-10.52%, net profit was $489 million, YoY-29.34%, EPS was $1.35, YoY-28.19%, and market estimate was $1.33. Q1 performance decline obviously, but special industry status, the early stage low of $185 may be the bottom of the past two years, the medium and long-term can be held above $190 with confidence. High-end personal daily chemical can always maintain growth, low-end but cruel competition, compared to the stock price is also all the way down, as long as the level of residents’ income is improving, this piece of business can continue to maintain growth, which is the logic of long-term bullishness. This is the reason for the premium relative to Unilever and Procter & Gamble, the logic of continuous growth continues to grow, and there is long-term holding value.
Historical Forecast Record:
2022.9.23 From the technical chart, the recent stock price fell below the 60-day moving average again, the signs of weakness are very obvious, the possibility of testing the previous low of 224 yuan is higher, short-term trading recommendations are backed by $225 high selling low sucking, stop loss level of 225 yuan, trading range between $225-$255. From the combination of candlesticks, there is no upside at the midline level for the time being.
2022.1.11 From the technical chart, the stock price has fallen below the 60-day moving average, but it is now impossible to judge whether the stock price has peaked, continued to decline after the adjustment, or maintained a longer range shock, which needs to be confirmed by subsequent transactions. Medium and long-term long orders can temporarily leave the market and make up for it after the stock price rises above the 60-day moving average. Short-term long orders temporarily abandoned, wait for the direction to be clear before entering the market. It is recommended that short-term trading be held long above the 20-day moving average, and medium- and long-term long positions above the 60-day moving average, which is extremely likely to strengthen further. In the order of exits, short-term trading stock prices fell below the 20-day moving average and turned short, and medium and long-term trading fell below the 60-day moving average to turn short. Here I would like to highlight why the short-term needs to exit after falling below the 20-day moving average, and the mid-line 60-day moving average exits, in order to avoid the protection of profits from larger drawdowns. If the trend does not change, it is not too late to wait for the stock price to rise above the moving average and then make up for it, and the cost is relatively low. From a fundamental point of view, although the stock price is more expensive, but high-end personal daily chemical can always maintain growth, low-end but cruel competition, compared to the stock price is also all the way down, as long as the level of residents’ income is improving, this piece of business can continue to maintain growth, which is the logic of long-term bullishness. This is the reason for the premium compared to Unilever and Procter & Gamble, operating income continues to grow, the logic of continuous growth exists, and has long-term holding value.
2021.12.24 From the technical chart, the stock price is only one step away from the previous high, and the medium and long-term long positions continue to hold. Short-term trading is temporarily avoided. A good short-term entry is at $350, a stop loss of $346, and a target of $360. At present, it is still in an uptrend, it is recommended to hold long positions above the 20-day moving average for short-term trading, and long positions above the 60-day moving average for medium and long-term trading, and the possibility of further strengthening is extremely high. In the order of exits, short-term trading stock prices fell below the 20-day moving average and turned short, and medium and long-term trading fell below the 60-day moving average to turn short.
2021.12.22 From the technical chart, the short-term adjustment of stock prices does not change the trend of medium- and long-term strengthening. Medium and long-term long positions continue to hold, short-term long positions are recommended to intervene above $348, stop loss is $348, target price of $360. At present, it is still in an uptrend, it is recommended to hold long positions above the 20-day moving average for short-term trading, and long positions above the 60-day moving average for medium and long-term trading, and the possibility of further strengthening is extremely high.
2021.12.18 From the technical chart, the stock price opened low and went low, rebounded slightly during the session, but also stopped near the average price, closing down 4.6%. This sharp decline in the plate does not represent a reversal of the trend, the confirmation of the trend also needs to be judged by the later trend, it is still in the uptrend, it is recommended that short-term trading above the 20-day moving average hold more, medium and long-term above the 60-day moving average long hold, the possibility of further strengthening is extremely high. In the order of exits, short-term trading stock prices fell below the 20-day moving average and turned short, and medium and long-term trading fell below the 60-day moving average to turn short. Here I would like to highlight why the short-term needs to exit after falling below the 20-day moving average, and the mid-line 60-day moving average exits, in order to avoid the protection of profits from larger drawdowns. If the trend does not change, it is not too late to wait for the stock price to rise above the moving average and then make up for it, and the cost is relatively low. From a fundamental point of view, although the stock price is more expensive, the operating income continues to grow, and the logic of continuous growth exists, and it has long-term holding value.
2021.12.17 From the technical chart, the stock price is in an uptrend, it is recommended to hold long positions above the 20-day moving average for short-term trading, and long positions above the 60-day moving average for medium and long-term trading, which is highly likely to strengthen further. In the order of exits, short-term trading stock prices fell below the 20-day moving average and turned short, and medium and long-term trading fell below the 60-day moving average to turn short.
2021.11.07 From the technical chart, the stock price is in an uptrend, it is recommended to hold long positions above the 20-day moving average for short-term trading, and long positions above the 60-day moving average for medium and long-term trading, with a high probability of further strengthening. In the order of exits, short-term trading stock prices fell below the 20-day moving average and turned short, and medium and long-term trading fell below the 60-day moving average to turn short. From a fundamental point of view, although the stock price is more expensive, the logic of continuous growth exists, and it has long-term holding value.
Key Quote Data:
52 Week Range: 186.47-374.20
P/E Ratio(TTM): 41.32
EPS(TTM): $6.00
Market Cap: $88.53 B
Number of employees: 63000 historical data 44640
Summary of recent financial statements
2022.11.02 Revenue for the first quarter of fiscal 2023 was $3.93 billion, market estimate was $3.97 billion, YoY-10.52%, net profit was $489 million, YoY-29.34%, EPS was $1.35, YoY-28.19%, and market estimate was $1.33.(Note: The default is GAAP, Non-GAAP will be explained separately)
By major product category, net sales of skin care products decreased 14% year-over-year to $2,101 million. Cosmetics net sales were $1,052 million, down 10% year-over-year. Net sales of fragrance products were $607 million, essentially flat year-over-year. Net sales of hair care products were $158 million, up 7% year-over-year.
fiscal Q1 adjusted earnings of $1.37 per diluted share, down from $1.89 a year earlier.Analysts polled by Capital IQ expected $1.31.
Revenue for the quarter ended Sept. 30 was $3.93 billion, compared with $4.39 billion a year ago.Analysts surveyed by Capital IQ expected $3.93 billion.
The company said it expects fiscal-year 2023 adjusted earnings of $5.25 to $5.40 per diluted share. Analysts polled by Capital IQ expect $7.36.
The company expects fiscal Q2 adjusted earnings of $1.19 to $1.29 per diluted share. Analysts polled by Capital IQ expect $2.82.
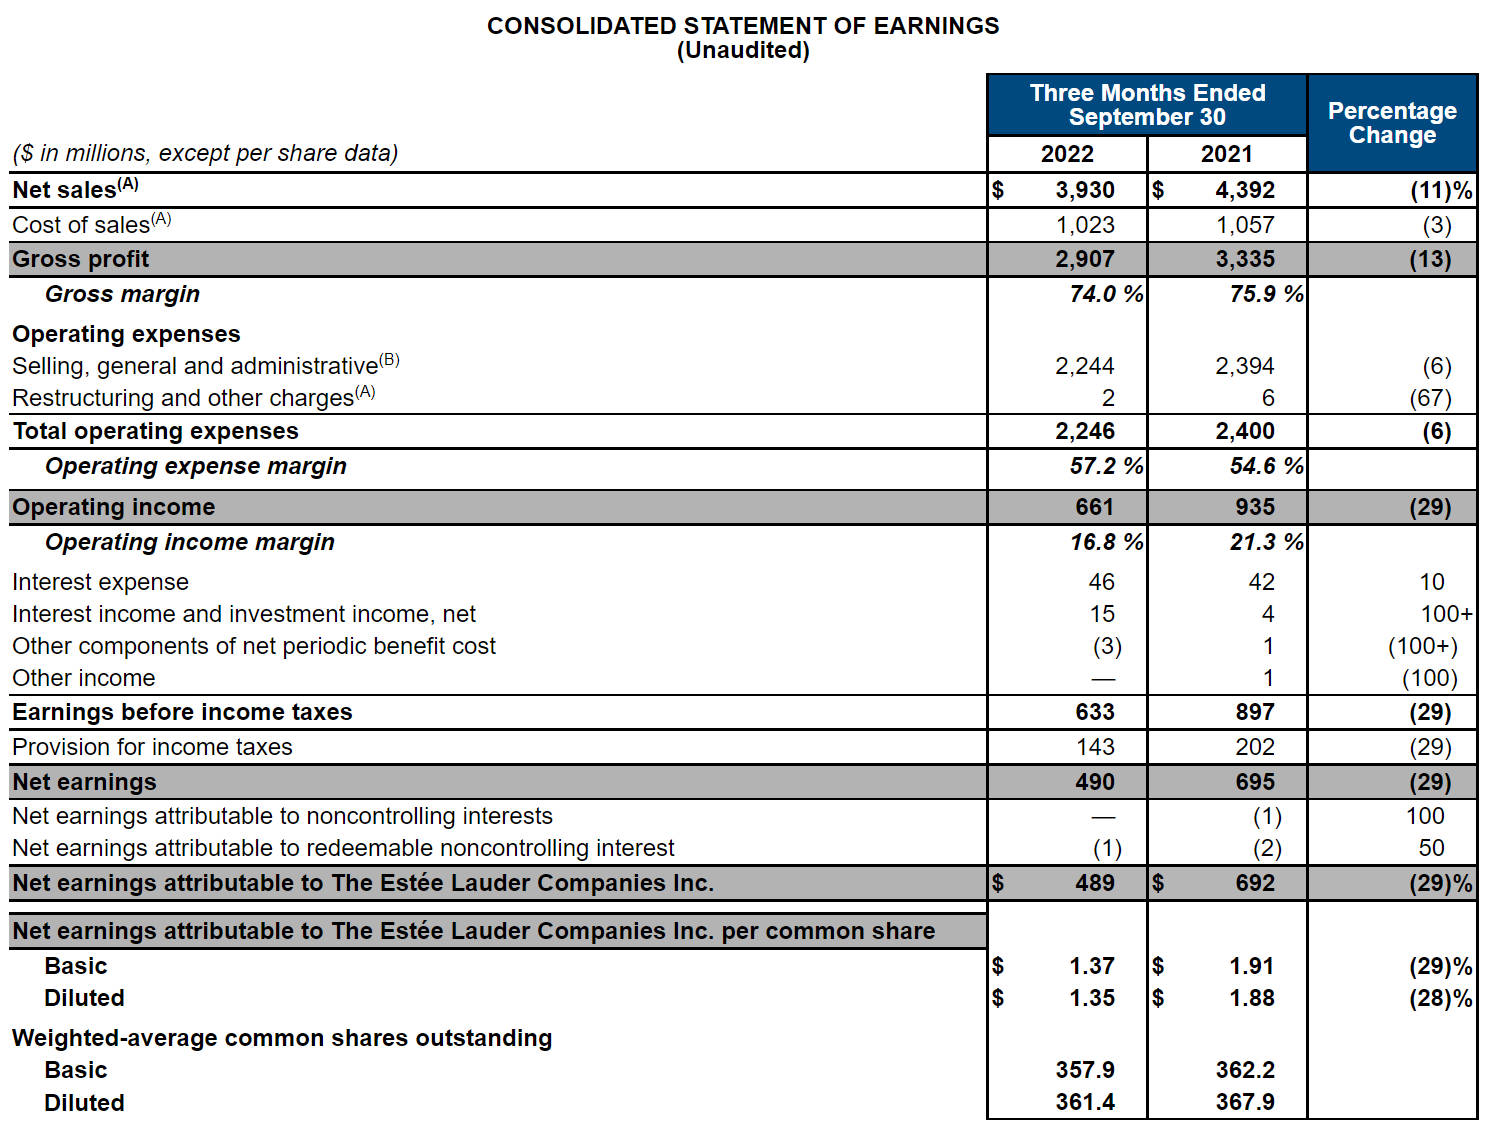
Estee Lauder (NYSE:EL) CONSOLIDATED STATEMENT OF EARNINGS
About Estee Lauder (NYSE:EL)
The Estée Lauder Companies Inc. is one of the world’s leading manufacturers, marketers and sellers of quality skin care, makeup, fragrance and hair care products. The Company’s products are sold in approximately 150 countries and territories under brand names including: Estée Lauder, Aramis, Clinique, Lab Series, Origins, Tommy Hilfiger, M·A·C, La Mer, Bobbi Brown, Donna Karan New York, DKNY, Aveda, Jo Malone London, Bumble and bumble, Michael Kors, Darphin Paris, TOM FORD BEAUTY, Smashbox, Ermenegildo Zegna, AERIN, Le Labo, Editions de Parfums Frédéric Malle, GLAMGLOW, KILIAN PARIS, Too Faced, Dr.Jart+, and the DECIEM family of brands, including The Ordinary and NIOD.