Goldman Sachs Group (NYSE:GS) stock price trend forecast and market analysis:
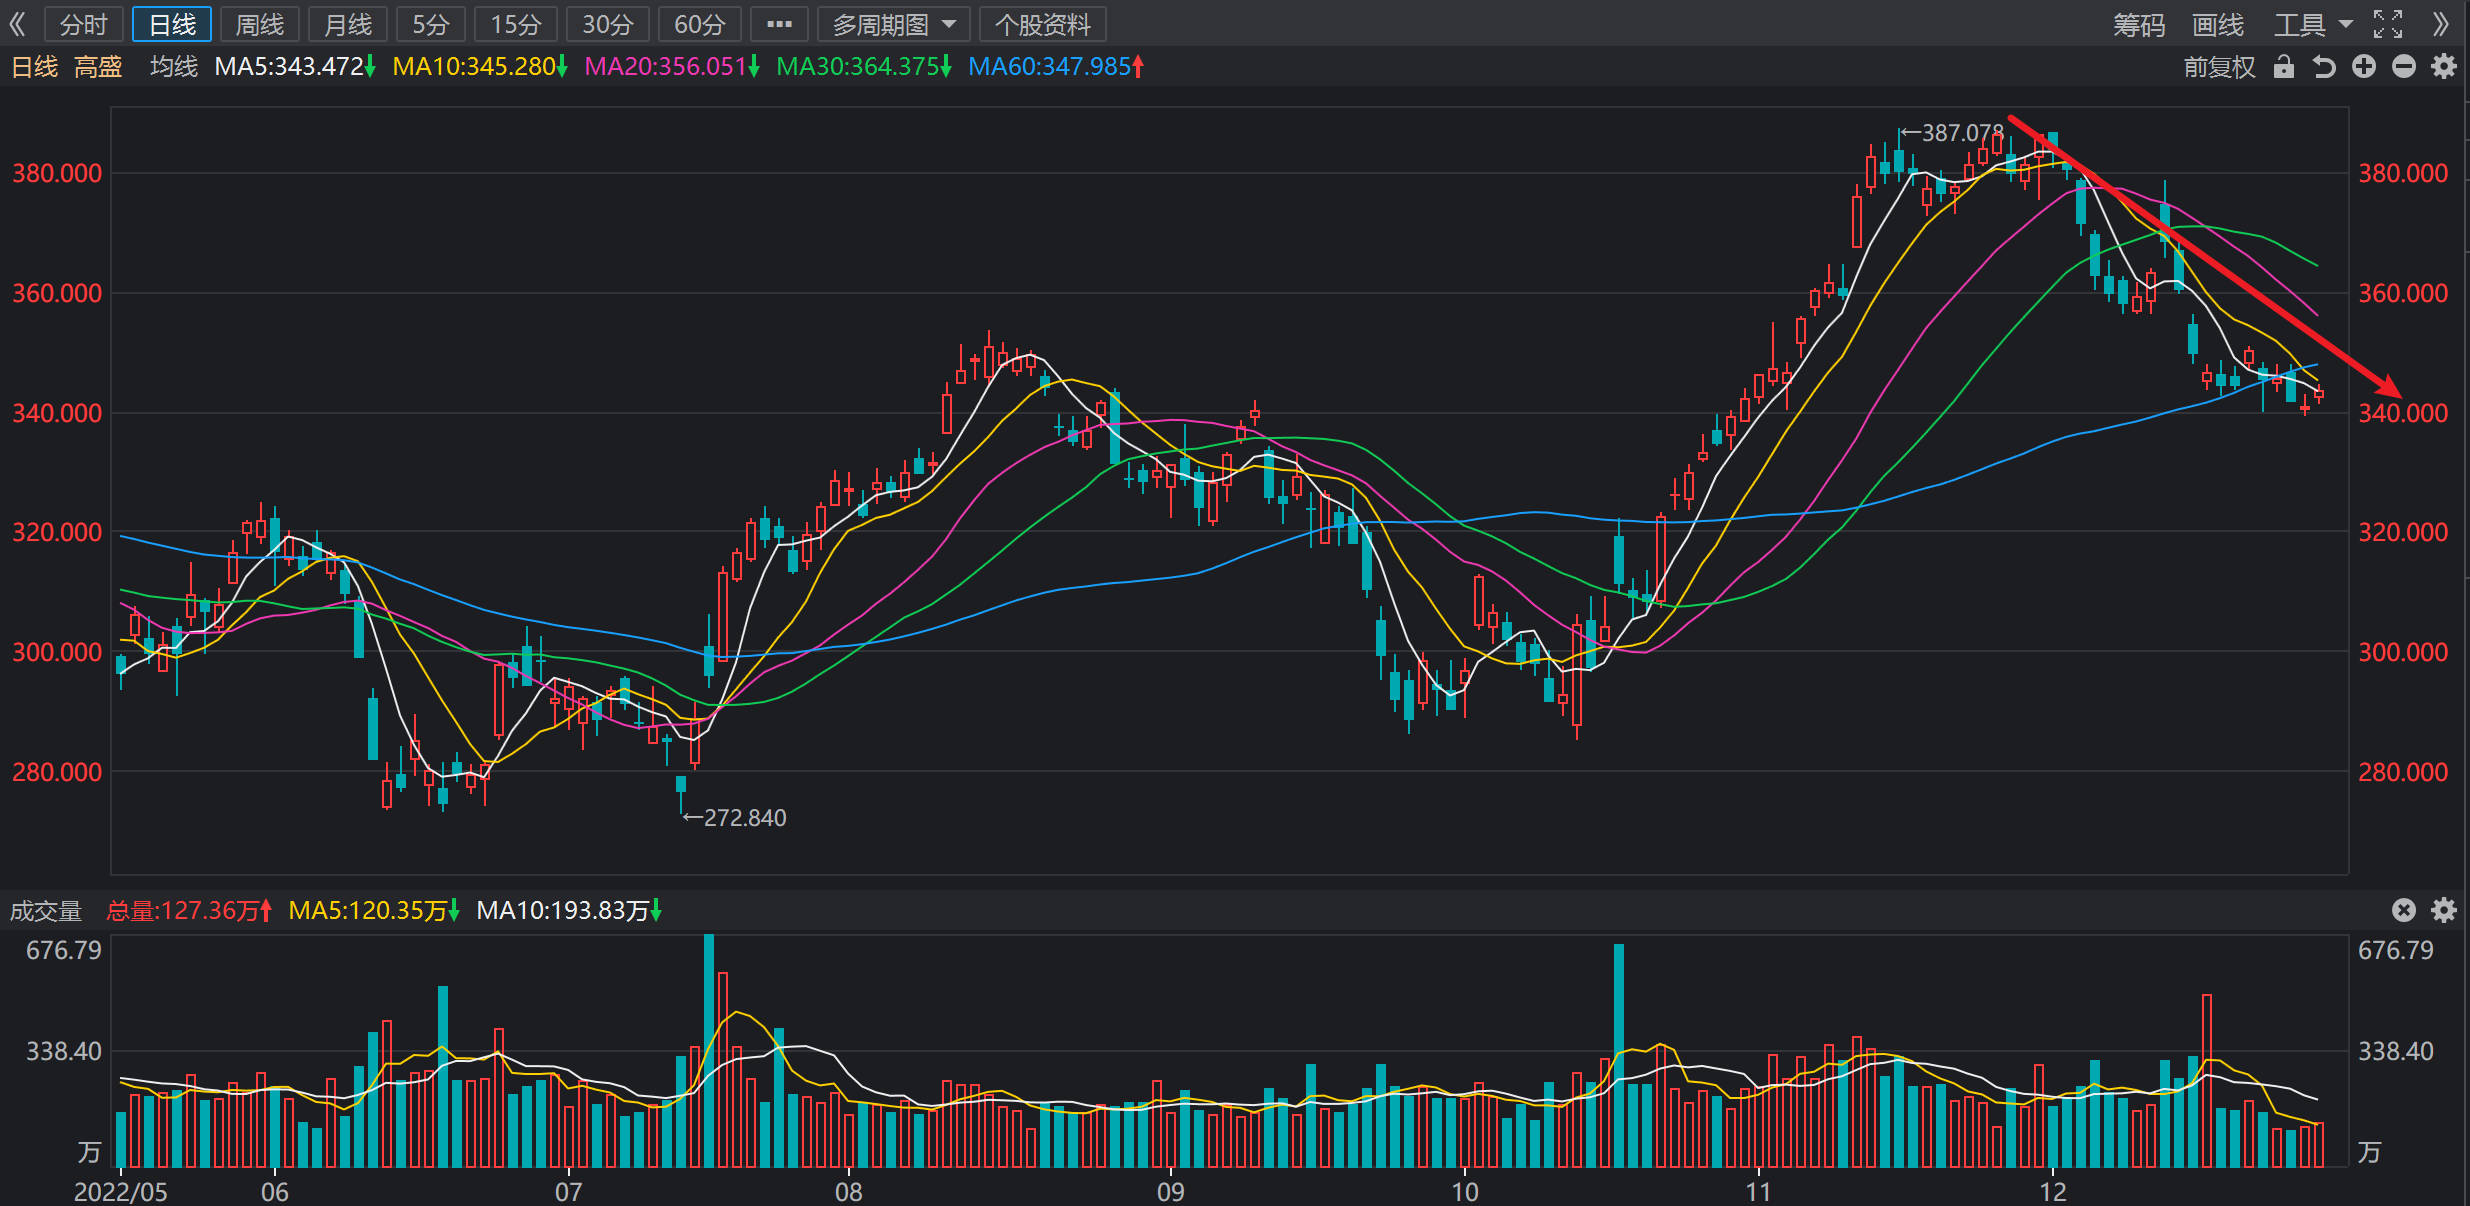
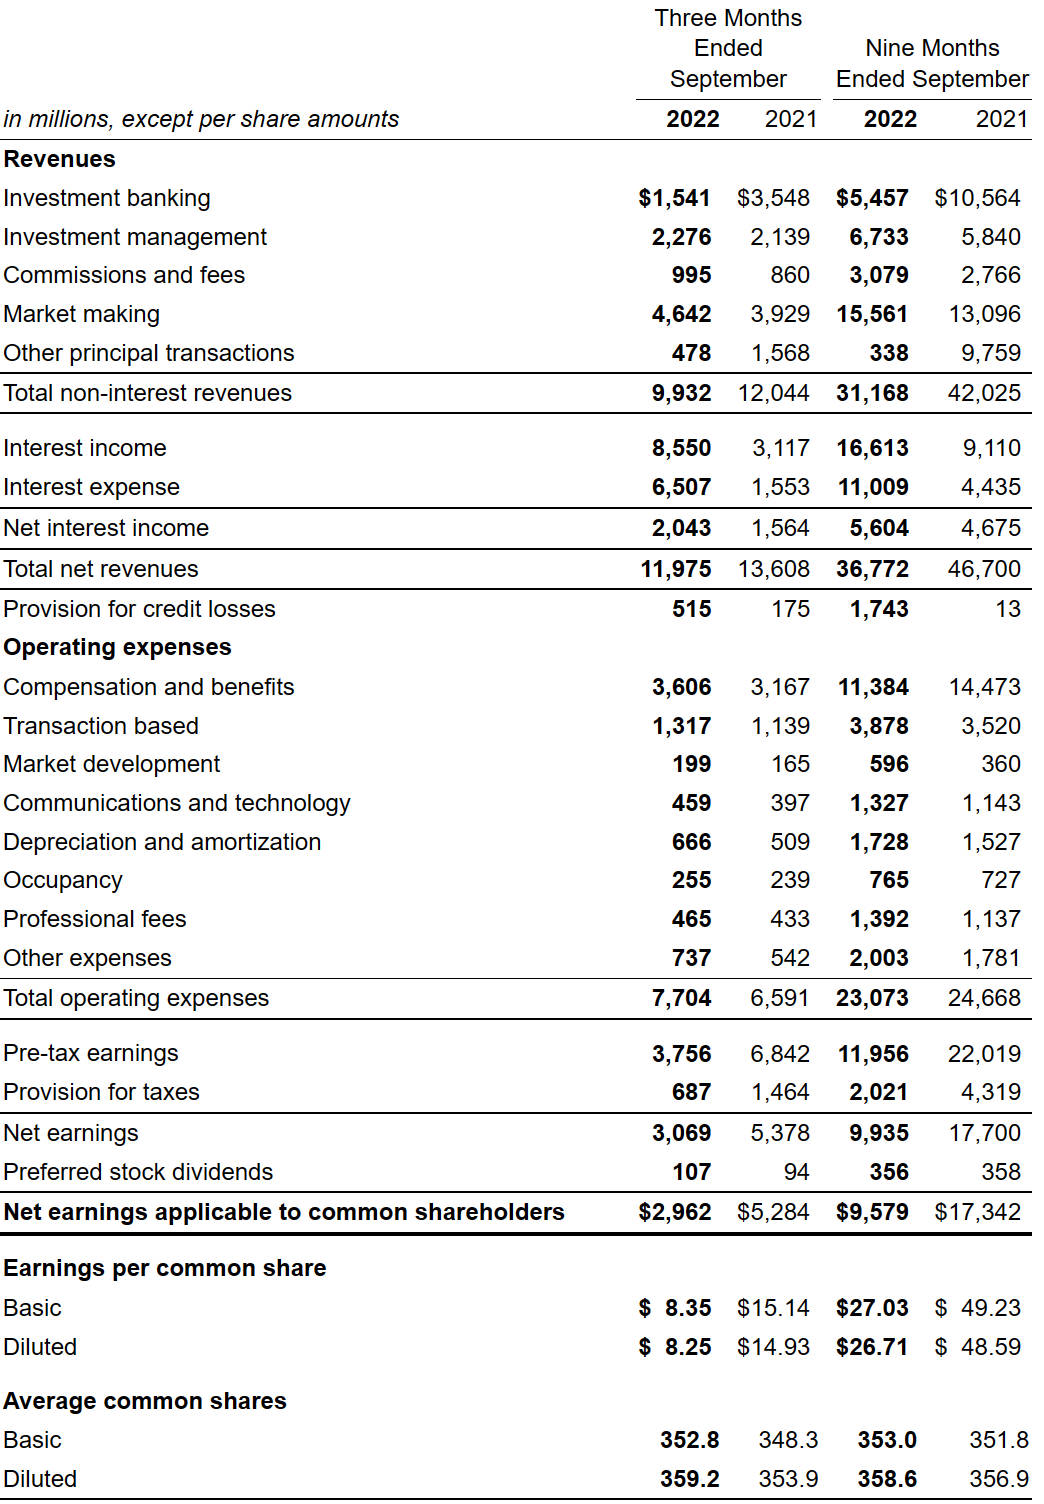
2022.12.29 From the stock chart analysis, the recent stock price continued to fall to $340, the bank index as a whole maintained a decline, short-term stock prices may rebound slightly and then fall below $340 again, with a target price of $310-$320. Medium-term and long-term holdings are less likely to be profitable in the short term, but the likelihood of long-term holding earnings will rise, with a target price of $400. From Analysis from financial statements, Q3 FY2022 achieved revenue of $11.975 billion, YoY-12.00%, net profit attributable to common shareholders of $2.962 billion, YoY-43.94%, EPS $8.25. Quarterly dividend of $2.50 per share. Investment banking business continues to decline, the probability of performance bottoming out is low, the possibility of weakening fundamentals continues to increase, it is recommended to trade with the idea of range shock. Even if the net profit of Q3 is used to annualize the full-year revenue, the P/E ratio TTM is expected to be about 11 times, which has obvious advantages and medium and long-term value. First-class enterprises, first-class stock prices, reasonable valuations, and the long-term bull pattern does not change.
Historical Forecast Record:
2022.12.07 From the analysis of stock technical graphics, the recent stock price ended its high volatility and continued to fall, falling below $360 intraday. The probability of a short-term continuation of the fall is high, and aggressive investors are backed by $345 to sell high or sell low or hold a position, with a stop loss price of $345 and a next support level of $320, which can be covered according to the situation. The probability of a medium and long-term pullback to the $300 line is high, and it is recommended that prudent investors can wait patiently for the right trading opportunity.
2022.10.26 From the technical chart, the stock price has recently risen sharply following the main indexes, and the stock price has come back to the upper band of range fluctuations, forcing into the pressure level of $340. The risk of short-term drawdown is high, and short-term trading is recommended to move the stop loss up to $325, and it is not recommended to cover back. Medium-term trading can be backed by $325, and the stop loss level can be moved up to $320, which can be covered. From the combination of candlesticks, there is no upside at the long-term level for the time being. However, based on valuation considerations, long-term buying at any time without stop loss. Recommended position 15%.
2022.10.7 From the technical graph, the recent stock price has followed the decline of major indexes, and there is no independent market. Yesterday’s intraday stock price fell back below 300 yuan, but compared to MS, JPM range is small, recommended short-term trading range of $298-$315, before the release of Q3 results, it is difficult to have an independent market. For the time being, there is no upside at the mid-line level and above, and short-term trading can flexibly sell high and sell low. Buy at any time for a long term, no stop loss. Recommended position 15%. From a fundamental point of view, Q2 2022 achieved operating income of $11.864 billion, YoY-16.82%, net profit attributable to common shareholders of $2.786 billion, YoY-47.9%, and EPS $7.81. Quarterly dividend of $2.50 per share. Year-on-year was mainly due to the decline in transaction revenue and investment banking business, which were 89.69% and -48.26%, respectively. Even if the annual revenue is annualized with Q2’s net profit, TTM is expected to be about 11 times, with obvious advantages and medium and long-term value. First-class enterprises, first-class stock prices, reasonable valuations, and the long-term bull pattern has not changed, and the net profit in 2021 reached a record $21.63 billion, and the logic of long-term holding remains unchanged.
2022.9.20 From the technical chart, the recent stock price has followed the decline of the main index, there is no independent market, the stock price in the last three trading days has fallen below the preset stop loss of 325 yuan in the previous period, it is recommended to short-term, mid-line exit avoidance. Move down the range to $310-$335. From the K-line portfolio, the stock price temporarily found support near the 60-day moving average, and there were short-term repeats, but the downside expectation was higher. Buy at any time for a long term, no stop loss. Recommended position 15%.
2022.9.13 From the technical chart, the recent stock price maintains a rebound trend, but the upper 360 yuan pressure level is more difficult, the probability of continuing to maintain 325 yuan-350 in the near future is higher, short-term trading high selling low absorption, try to trade in the range, stop loss level of 325 yuan, can make up. The midline buy point is 330 yuan, the target price is 350 yuan, and the stop loss is 325 yuan. Buy at any time for a long term, no stop loss. Recommended position 15%.
2022.1.19 From the technical chart, the stock price once again followed the index to fall, in the near term may test the support below $340, short-term trading with back $345 as a buy point, buy point $350, target price of $380, stop loss of $342, cover levels of $345 and $320. The value of medium- to long-term holdings is unchanged, and the near-term volatility range is expected to be between $340 and $400. From a fundamental point of view, first-class enterprises, first-class stock prices, reasonable valuations, long bull pattern not long ago, the net profit in 2021 reached a record $21.63 billion, long-term holding logic unchanged.
Key Quote Data:
52 Week Range: 277.84-412.66
P/E Ratio(TTM): 9.15
EPS(TTM): $37.55
Market Cap: $115.43 B
Number of employees: 43900 historical data 40500
Summary of recent financial statements
In fiscal 2022, Q3 achieved revenue of $11.975 billion, YoY-12.00%, net income attributable to common shareholders of $2.962 billion, YoY-43.94%, and EPS of $8.25. Quarterly dividend of $2.50 per share. Revenue exceeded market expectations of $11.5 billion; EPS was $14.93 a year ago versus market expectations of $7.51. By business, investment banking net revenue was US$1.58 billion, down 57% year-over-year. Global markets net revenue was $6.20 billion, up 11% year-over-year, with fixed income, foreign exchange and commodities (FICC) revenue increasing 41% to $3.53 billion and equity revenue down 14% to $2.68 billion. Net revenue from asset management business was US$1.82 billion, down 20% year-over-year; Consumer & Wealth Management net revenue was $2.38 billion, up 18% year-over-year. The provision for credit losses was $515 million, below market expectations of $755 million and up from $175 million in the year-ago quarter. Net interest income of $2.04 billion was higher than market expectations of $1.77 billion and up from $1.56 billion in the year-ago quarter. Total operating expenses of $7.70 billion were higher than market expectations of $7.17 billion and also higher than $6.59 billion in the year-ago quarter. Compensation and benefits expense of $3.61 billion, above market expectations of $3.4 billion and up from $3.17 billion in the year-ago quarter.
The Goldman Sachs Group, Inc. is a leading global financial institution that delivers a broad range of financial services across investment banking, securities, investment management and consumer banking to a large and diversified client base that includes corporations, financial institutions, governments and individuals. Founded in 1869, the firm is headquartered in New York and maintains offices in all major financial centers around the world.