Meta Platforms, Inc. (NASDAQ:META) STOCK PRICE TREND FORECAST AND MARKET ANALYSIS:
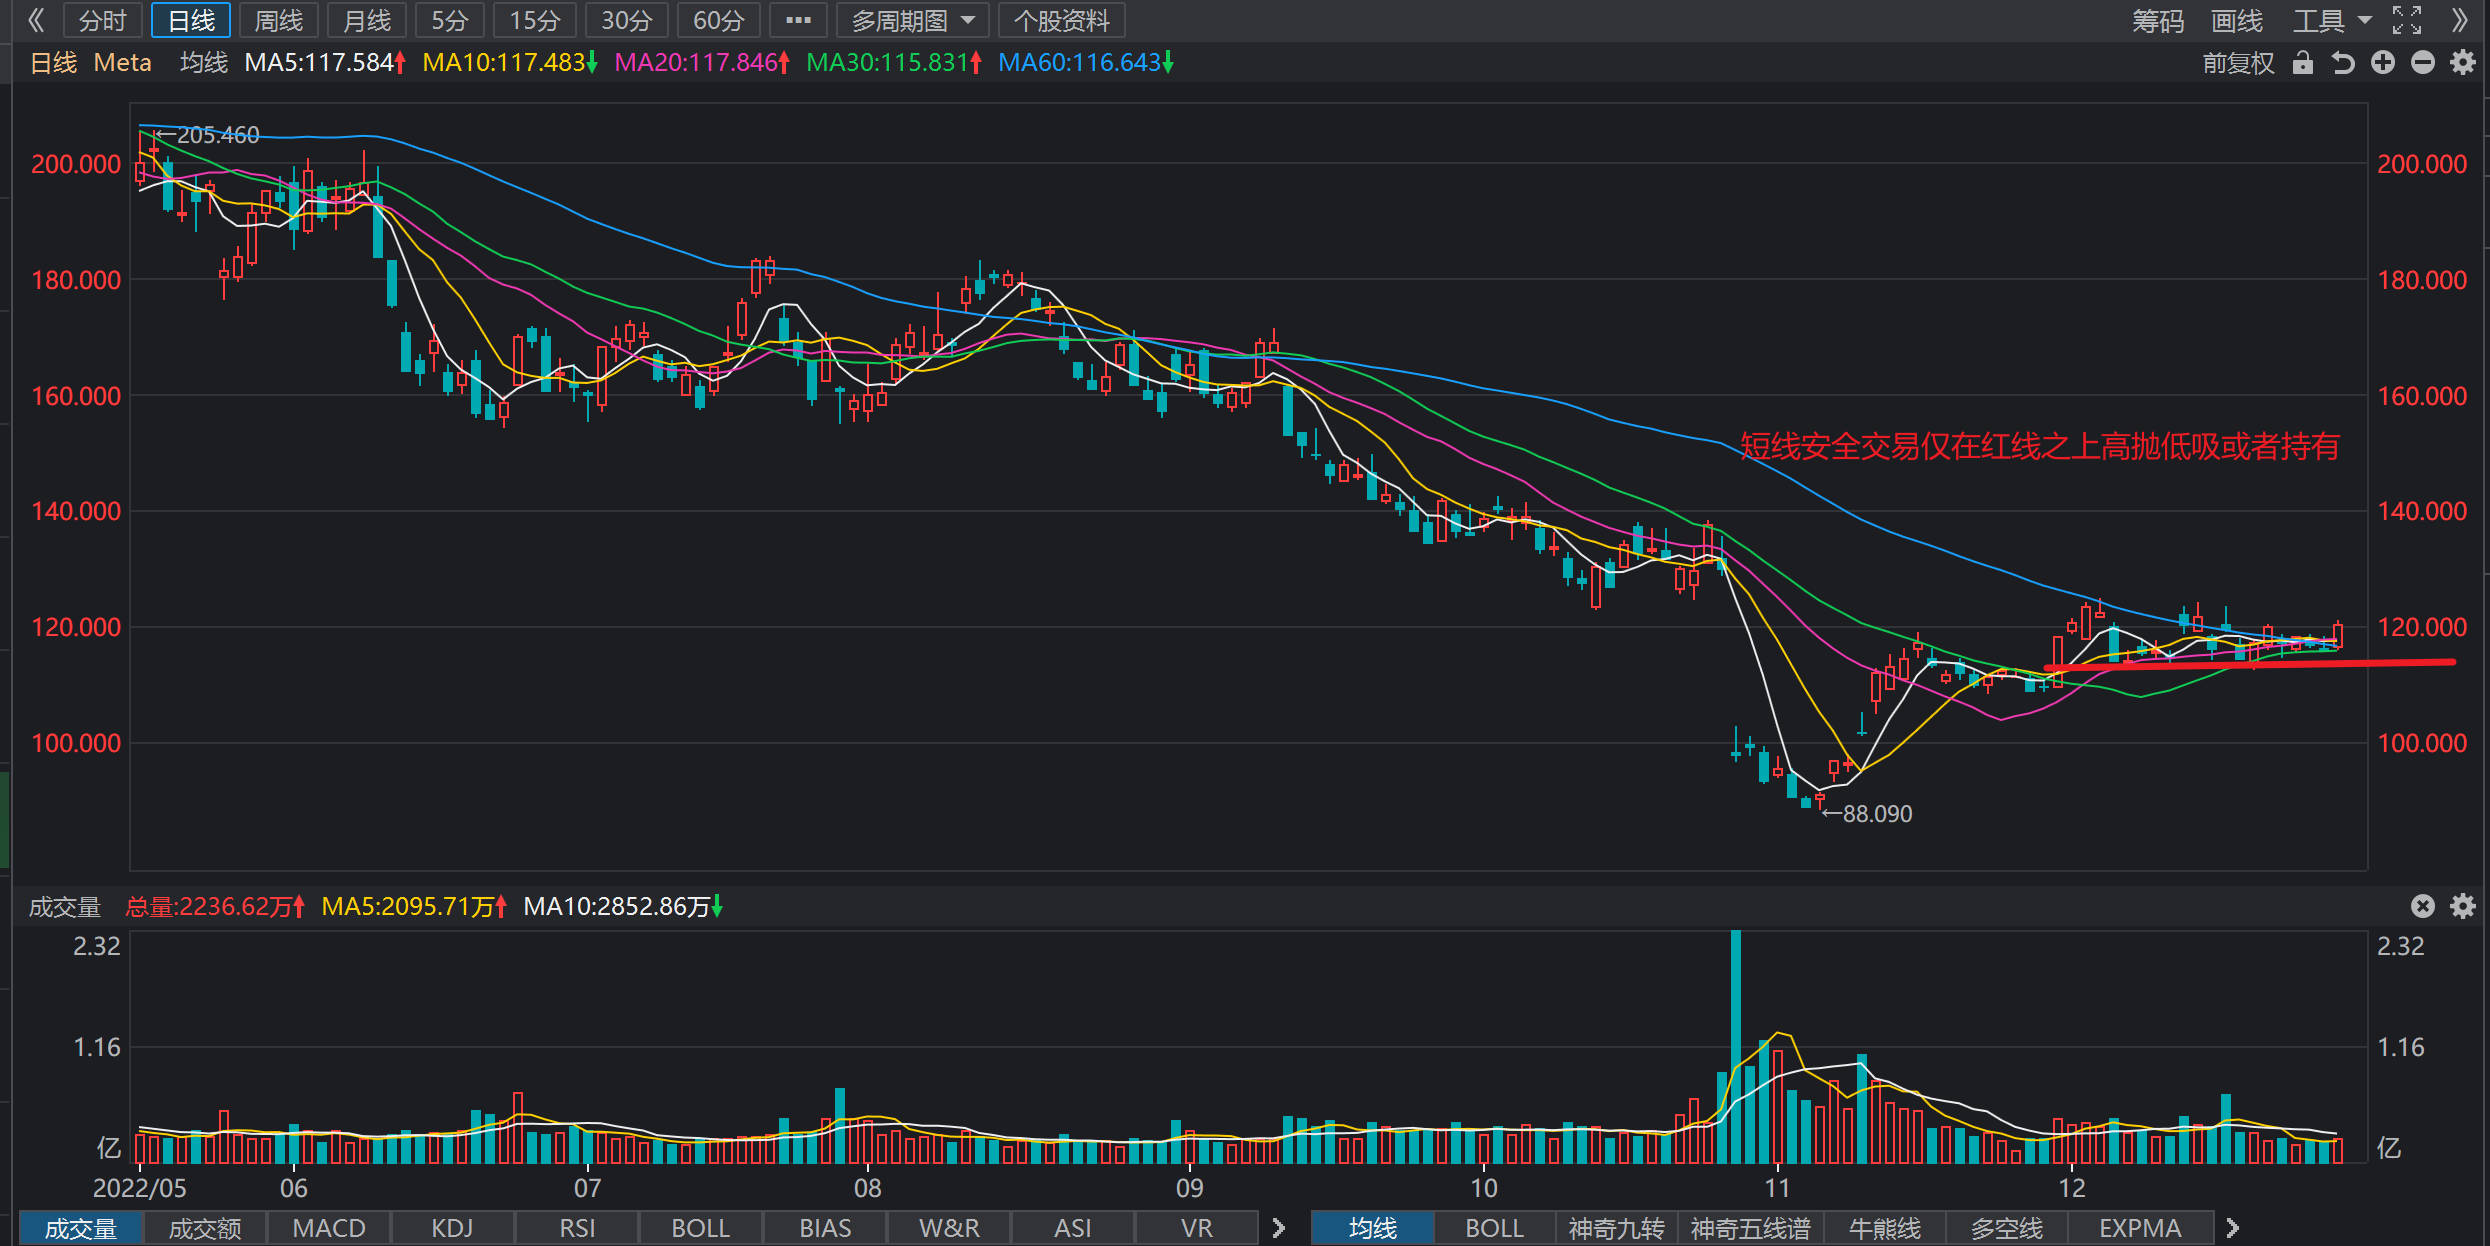
2022.12.29 FROM THE STOCK chart ANALYSIS, THE RECENT STOCK PRICE PERFORMANCE IS STRONGER THAN THE NASDAQ INDEX AND INDUSTRY INDEX, THE STOCK PRICE REMAINS AT $115-$120, AND THE PROFIT OPPORTUNITY IS HIGHER. The probability of short-term choice of direction is higher, the first case is to break upwards and make up for the gap in the previous round, but this probability is low, the main criterion is whether it effectively breaks through $130, if the stock price effectively breaks through the upward target price to $160-$180. The second continues to return to the $100-$125 range of oscillations and continues to build a bottom, which is more likely. The possibility of a dip below $100 is that Q4 results are reported less than expected. It is recommended to buy $85-$100 in the middle line, with a large profit margin. From a fundamental point of view, Q3 2022 achieved operating income of $27.714 billion, YoY-4.47%, net profit attributable to common shareholders of $4.395 billion, YoY-52.20%, and EPS of $1.64. R&D expenses were 9.17 billion US dollars, YoY+45.19%. At present, the stock price does not fully reflect the risk of declining advertising demand, and it is recommended that the medium and long-term buying points remain below $100, with the medium and long-term holding value space unchanged.
Historical Forecast Record:
2022.12.16 From the stock technical chart analysis, the recent stock price performance is stronger than the industry index, the possibility of short-term choice of direction is higher, the first case is an upward breakout, back to make up for the gap in the previous round, but this possibility is low, the main judgment standard is whether it effectively breaks through $130, if the effective breakthrough can be seen high to $160-$180 line. The second continues to return to the $100-$125 range of oscillations and continues to build a bottom, which is more likely. The possibility of a dip below $100 is that Q4 results are reported less than expected. Short-term trading is recommended to back $110 high sell low, stop loss price of $110, can be covered according to the situation. It is recommended to buy $85-$100 in the middle line, with a large profit margin.
2022.12.09 From the analysis of stock technical graphics, although the stock price has rebounded sharply recently, it has not departed from the overall downtrend, and it has only touched the 60-day moving average and began to fall. The probability of short-term pullback is high, it is recommended that short-term trading back to $105 high sell low or hold, stop loss price of $105, once it falls below $105, the stock price will fall back to $88-$110 The probability will rise sharply, and the next time to make up $100. From a fundamental point of view, Q3 2022 achieved operating income of $27.714 billion, YoY-4.47%, net profit attributable to common shareholders of $4.395 billion, YoY-52.20%, and EPS of $1.64. R&D expenses were 9.17 billion US dollars, YoY+45.19%. Q3 sales revenue turned negative year-on-year, net profit fell sharply by 52% year-on-year, the money-burning game continued, but the competitiveness did not change, the current stock price position is worth suggesting medium and long-term positions, but the position should not be too high, it is recommended that the maximum should not exceed 10%. The long-term holding value space remains unchanged.
2022.11.07 From the technical chart, the stock price is in a medium and long-term downtrend, and it continues to plummet after the Q3 quarterly report, with an intraday low of $88, a new low in recent years. The recent slight rebound in stock prices does not mean a change in trend, and the near-term expected volatility range is between $85 and $110, and short-term trading recommendations are backed by $90 high and low. The medium and long-term holding space is temporarily not visible, but a small number of positions can participate in the game. Recommended position 10%.
2022.9.20 From the technical chart, the stock price is in a long-term downtrend, the current downward trend of the stock price slows down, but it does not mean that the stage bottom is established, the stock price continues to be prone to fall and difficult to rise, before the expectation has not changed, focus on the support level of the lower integer level of $140, $130. From the perspective of K-line combination, there is no medium and long-term long term long indicator for the time being. The short-term game can be backed by a $140 rebound, with a stop loss of $140 and a target of $160. Recommended position 10%. From a fundamental point of view, Q2 2022 achieved operating income of $28.822 billion, YoY-0.88%, net profit attributable to common shareholders of $6.687 billion, YoY-35.66%, and EPS $2.46. The company’s sales revenue turned negative year-on-year, net profit fell sharply, expenses increased sharply year-on-year, the company is in the process of transformation, and the long-term holding value space remains unchanged. But you also need to control your positions.
2021.10.28 From the technical chart, the stock price is in a downtrend, and the near term is expected to fluctuate between $300-330. From a fundamental point of view, the company’s business continues to grow at an annual rate of 20%, with long-term holding value, reasonable valuation, and only long-term holding of this world-class enterprise can lead the index in the capital market for a long time.
2021.9.18From the technical chart, the stock price has a tendency to fall below the 60-day moving average, focusing on the support of $350, if it falls below $350, it is recommended to leave the market for short-term more than one to take refuge, and then hold it after the stock price stabilizes. From a fundamental point of view, the company’s business continues to grow at an annual rate of 20%, with long-term holding value, reasonable valuation, and only long-term holding of this world-class enterprise can lead the index in the capital market for a long time.
Key Quote Data:
52 Week Range: 88.09-347.23
P/E Ratio(TTM): 11.46
EPS(TTM): $10.50
Market Cap: $306.57 B
Number of employees: 71970 historical data 71970
Summary of recent financial statements
2022.10.25 Q3 2022 achieved revenue of US$27.714 billion, YoY-4.47%, net income attributable to common shareholders of US$4.395 billion, YoY-52.20%, EPS US$1.64. R&D expenses were 9.17 billion US dollars, YoY+45.19%. Q3 2022 revenue was $27.71 billion, versus market expectations of $27.439 billion. Net income was $4,395 million, versus market expectations of $5,113 million. Q4 revenue is expected to be $30 billion to $32.5 billion, and the market expects $32.2 billion. The average number of daily active users reached 1.98 billion in September, up 3% year-on-year. Total spending in 2022 is expected to be between $85 billion and $87 billion. CEO Zuckerberg: We’re obviously doing some leading work that will pave the way for the next big computing platform. WhatsApp already has more than 2 billion daily active users.
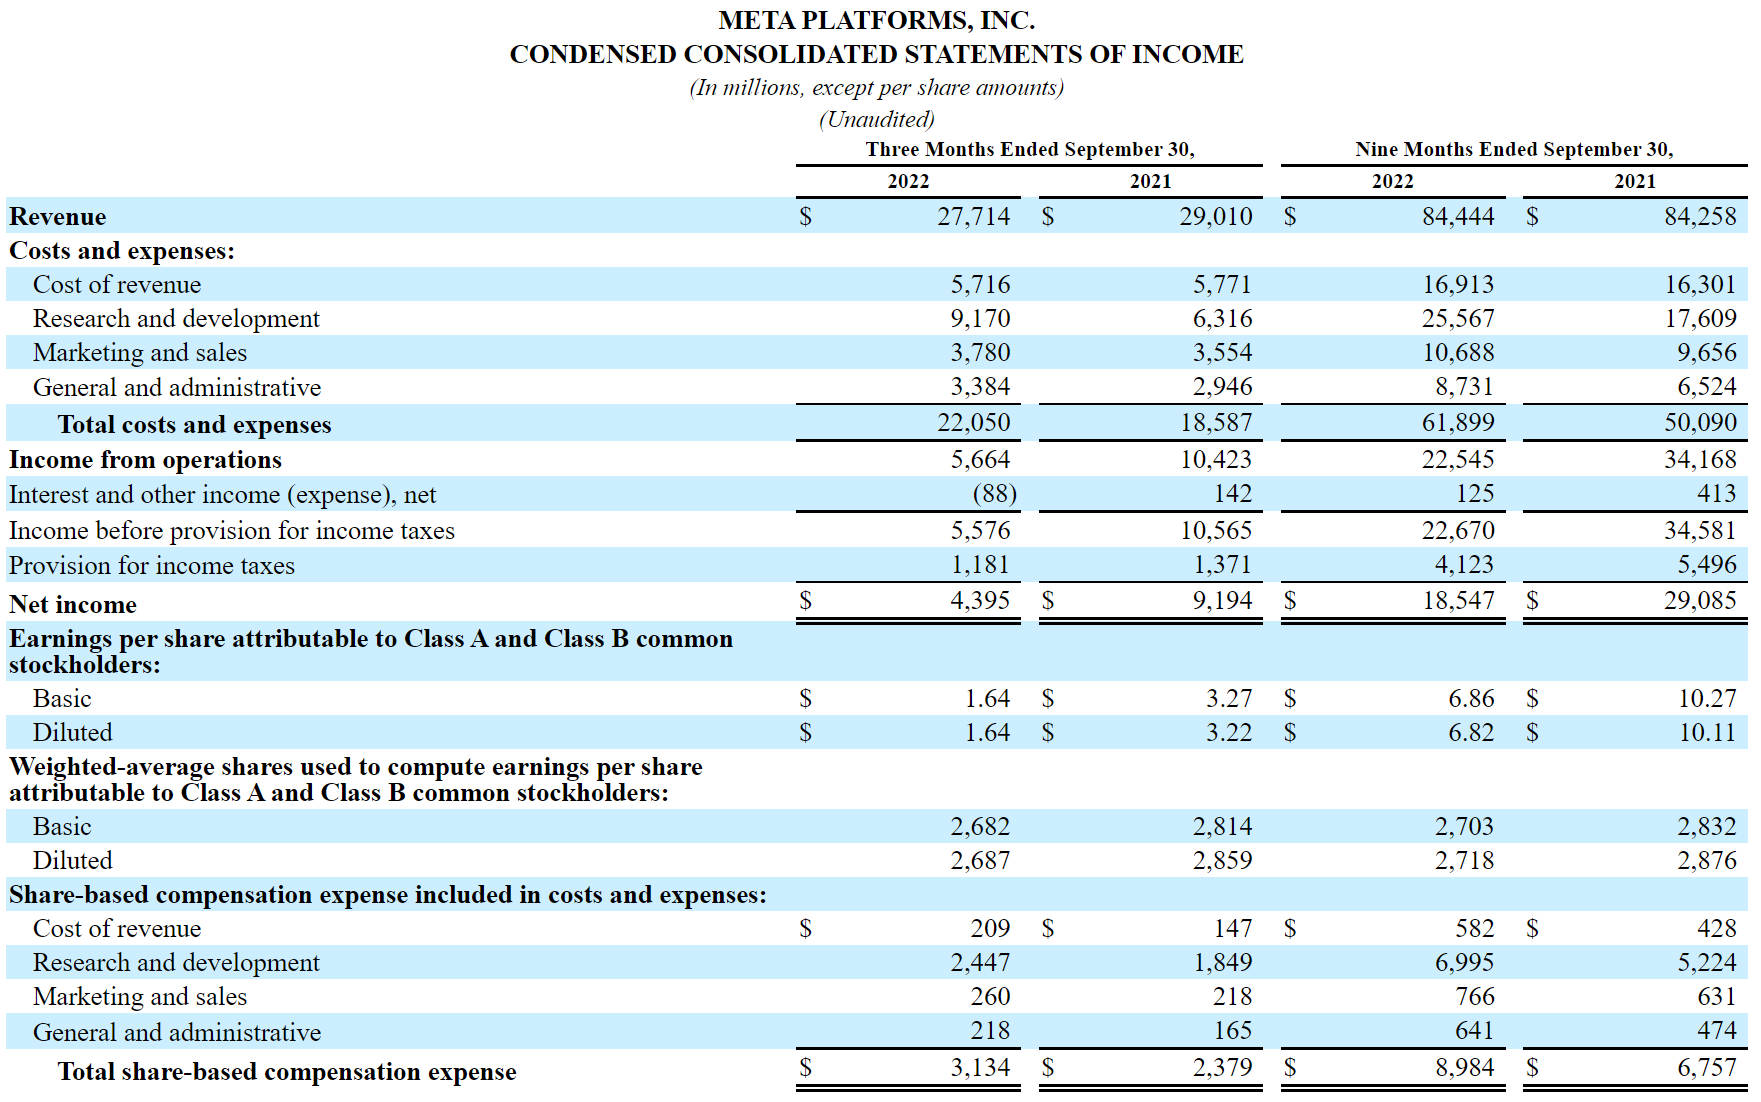
META PLATFORMS, INC. CONDENSED CONSOLIDATED STATEMENTS OF INCOME
About Meta Platforms, Inc. (NASDAQ:META)
Meta builds technologies that help people connect, find communities, and grow businesses. When Facebook launched in 2004, it changed the way people connect. Apps like Messenger, Instagram, and WhatsApp further empowered billions around the world. Now, Meta is moving beyond 2D screens toward immersive experiences like augmented and virtual reality to help build the next evolution in social technology.