FedEx Corp. (NYSE:FDX) stock price trend forecast and market analysis: 2022.12.27 From the stock chart analysis, The previous I think that the probability of medium and long-term decline has risen sharply, it is recommended that short-term trading and medium-term and long-term trading only hold above the 60-day moving average, the stop loss price is 60-day moving average, and the stock price stops falling and rises and the closing price is higher than the 60-day moving average when it makes up. Based on recent market sentiment, it is recommended to move the stop loss price to $170 in the short and medium lines. If the stock price falls below $170, the next Bo rebound position is at the 60-day moving average position, generally the moving average will not fall below once, and you can play repeatedly. The trading volume and trend are weak, the index is weak overall, and the probability of the stock price downside is high. From a fundamental point of view, operating income for the second quarter of fiscal 2023 was $22.814 billion, market expectations were $23.74 billion, YoY-2.81%, net income attributable to common shareholders was $788 million, YoY-24.38%, EPS was $3.07, YoY-20.88%. A quarterly dividend of $1.15 per share. Third-quarter adjusted earnings per share were $3.18, versus market estimates of $2.8, compared to $4.83 in the year-ago quarter. Based on the Q2 annualized net profit price-to-earnings ratio, the TTM is predicted to be 15 times, although there is a certain valuation advantage, but according to the dividend calculation, it is still relatively expensive, and it is not recommended to hold stocks with downward Revenue and net profit in the medium and long term.
Historical Forecast Record:
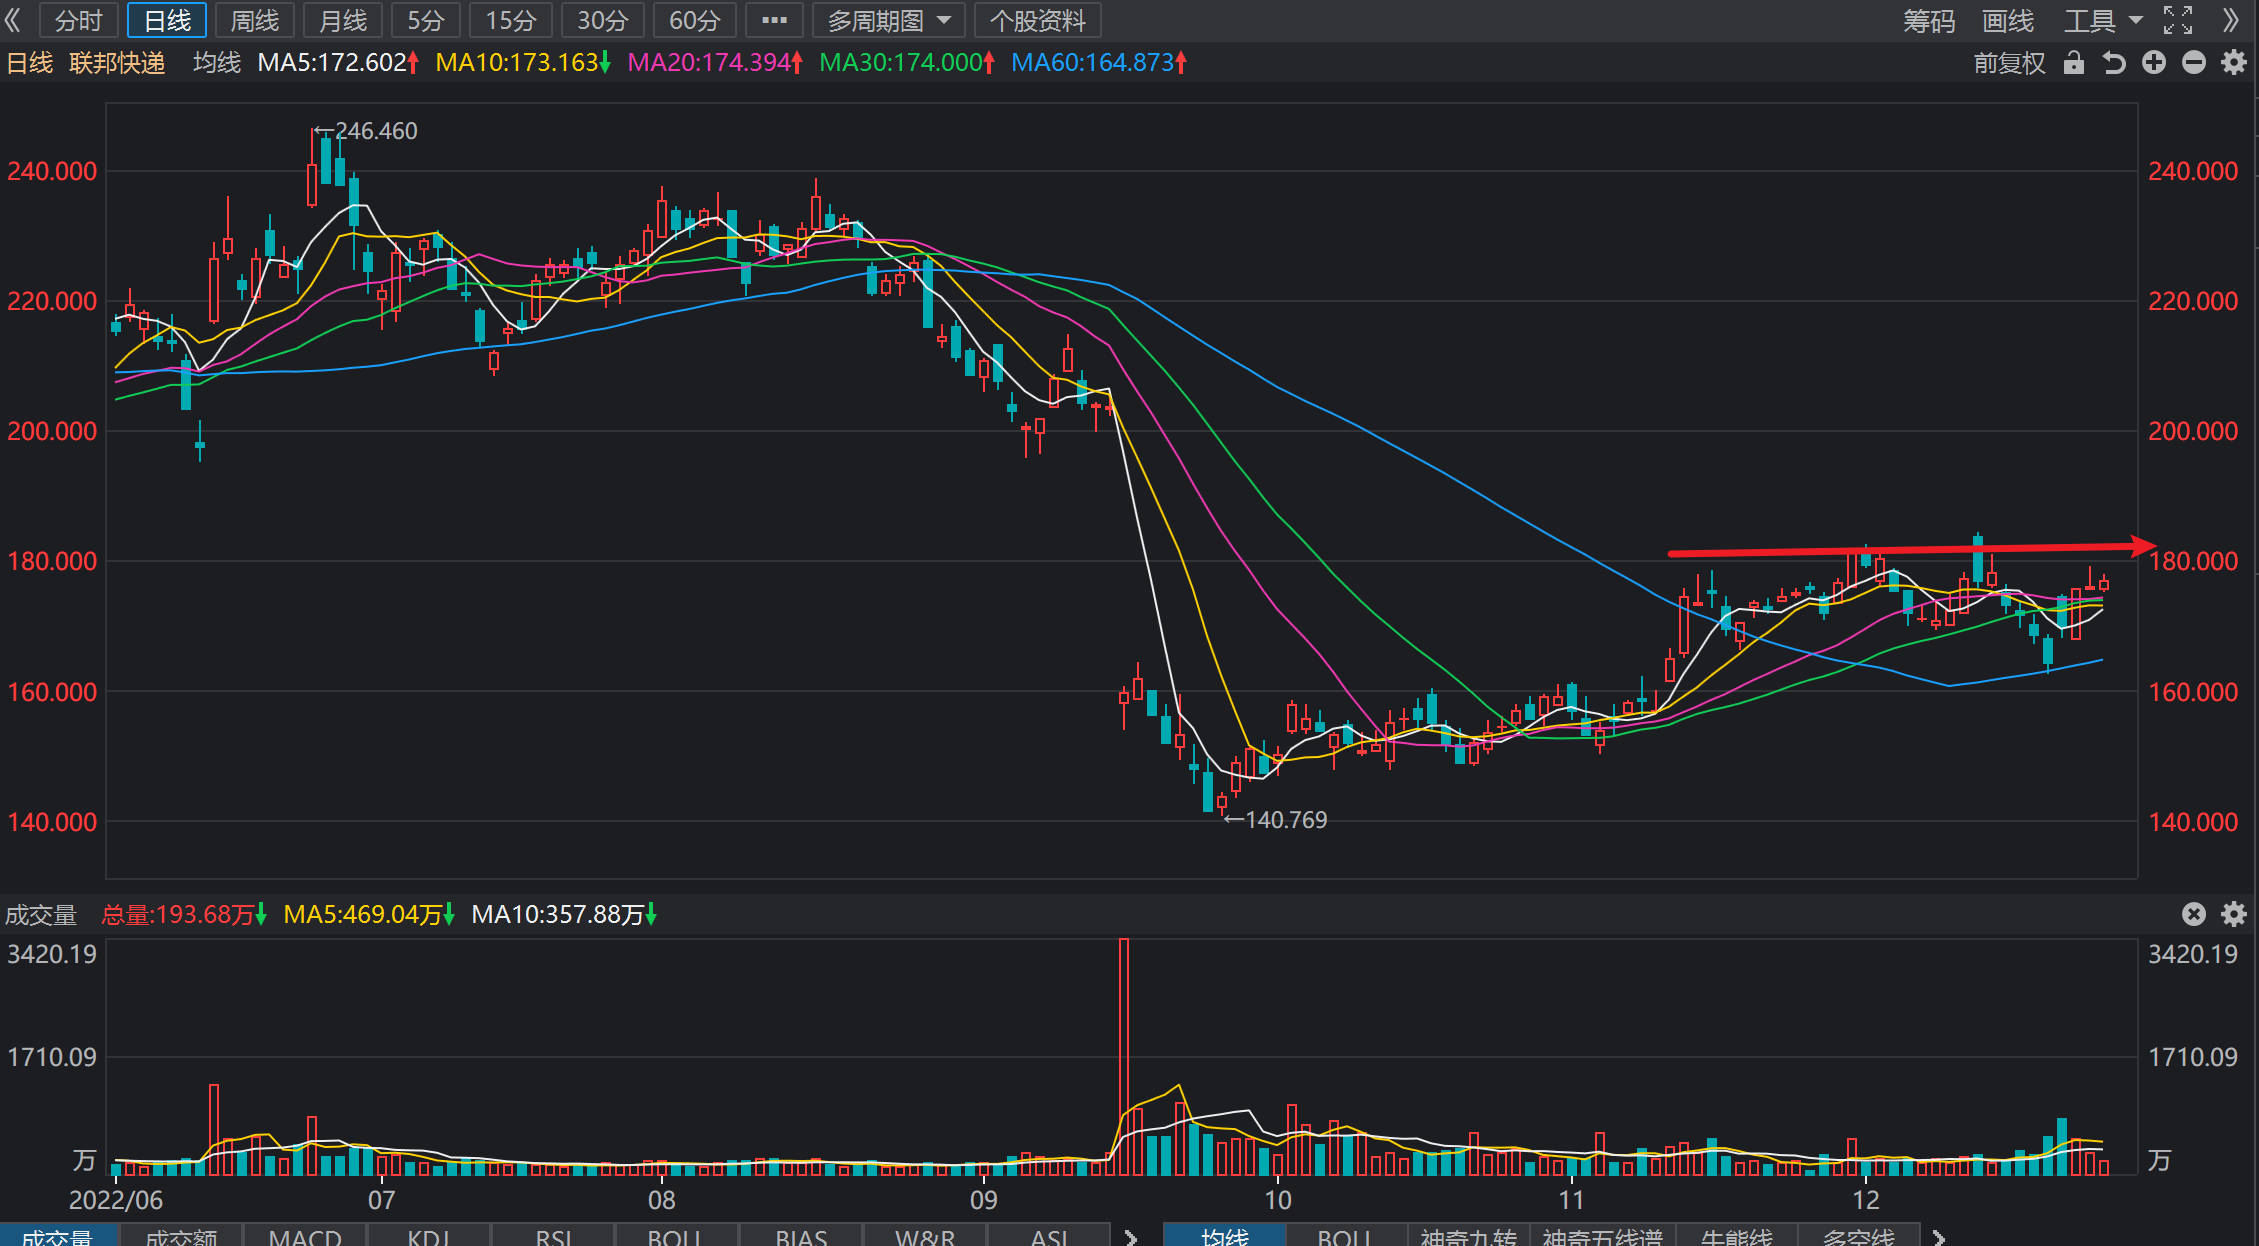
2022.12.22 From the analysis of the stock technical graph, in the last issue I recommended moving the stop loss price up to $170, and it has fallen below the stop loss price of $170 during the session. Affected by the financial report exceeding expectations, the stock price temporarily withstood the impact of the downward trend of the index, but the probability of a medium and long-term decline has risen sharply, it is recommended that short-term trading and medium-term and long-term trading are only held above the 60-day moving average, and the final stop loss price is 60-day moving average, and the stock price stops falling and rises and the closing price is higher than the 60-day moving average when it makes up.
2022.12.13 From the stock technical chart analysis, continue to maintain the previous view, but move the stop loss price up to $170, the stock price rebound trend has the possibility of ending, the probability of a recent fall is high, it is recommended that short-term trading and medium-term trading are backed by $170 high selling low absorption or holding, the stop loss price is $170, and can be covered according to the situation. From a fundamental point of view, Q1 2023 achieved operating income of $23.2 billion, YoY+5.45%, net profit attributable to common shareholders of $875 million, YoY-21.4%, EPS $3.33, YoY-22.82%. A quarterly dividend of $1.15 per share. FedEx freight rates will increase by an average of 6.9%-7.9%; global parcel and freight volumes will decline by 11% year-on-year. Cost savings of $2.2 billion to $2.7 billion are expected in 2023; It expects to repurchase $1.5 billion of common stock in fiscal 2023. Based on the net profit forecast after Q1 annualized TTM of 10 times, although there is a certain valuation advantage, but according to the dividend calculation, it is still relatively expensive, and it is not recommended to hold stocks with downward fundamentals in the medium and long term.
2022.12.09 From the stock technical chart analysis, the stock price rebound trend has the possibility of ending, the probability of a recent fall is high, it is recommended that short-term trading and medium-term trading back to $165 high sell low or hold, stop loss price of $165, can be covered according to the situation.
2022.9.22 From the technical graph, the stock price continues to fall in recent trading days, although there are repeats in the session, but today’s intraday stock price continues to hit a new low of $150.34, from the K-line combination, this is not the bottom of the stock price, the stock price in a short rebound, the probability of continuing to make a new low is extremely high, continue to maintain the previous view, has opened a new downside, can not find a long indicator for the time being, it is recommended to temporarily avoid, it is not recommended to participate in trading before the stock price stabilizes.
2022.9.16 From the technical graphic, due to the release of the revocation of fiscal year 2023 performance guidance and Q1 performance report, the stock price plummeted by 23%, the latest price of 156.5 US dollars, has opened a new downside, can not find a long indicator for the time being, it is recommended to temporarily avoid, it is not recommended to participate in trading until the stock price has stabilized. From a fundamental point of view, Q1 2023 achieved operating income of $23.2 billion, YoY+5.45%, net profit attributable to common shareholders of $875 million, YoY-21.4%, EPS $3.33, YoY-22.82%. Quarterly dividend of $2.30 per share. It will withdraw its FY2023 earnings forecast provided on June 23, 2022. For the second quarter of fiscal 2023, FedEx currently expects revenues of $23.5 billion to $24.0 billion and diluted earnings per share of $2.65 or more, excluding diluted earnings per share of $2.75 or higher for costs associated with business optimization programs and business restructuring activities. Continued plans to repurchase $1.5 billion of FedEx common stock in fiscal 2023. The earnings outlook has deteriorated rapidly, and there are no conditions for going long and bullish for the time being.
2021.10.9 From the technical chart, the stock price has fallen below $219, focusing on the support of $210 and $200 in the near future, if the support is effective, you can test a small number of orders, only fast forward and fast out, no signs of upward trend. From a fundamental point of view, the valuation is relatively reasonable, and it can be long term in the $200 first-line layout.
2021.10.7 From the technical chart, the stock price has fallen below $219, the recent focus on $210 and $200 support, if the support is effective, you can test a small number of orders, only fast forward and fast out, no signs of upward trend. From a fundamental point of view, the valuation is relatively reasonable, and it can be long term in the $200 first-line layout.
2021.10.1 From the technical chart, after several consecutive trading days of decline, the stock price has fallen below $219, the recent focus on $210 and $200 support, if the support is effective, you can test a small number of orders, only fast forward and fast out, no signs of upward trend. From a fundamental point of view, the valuation is relatively reasonable, and it can be long term in the $200 first-line layout.
2021.9.23 From the technical graphic, today because the company issued an announcement to reduce the 2022 fiscal year performance expectations, the stock price fell by 9%, it is recommended to avoid more orders, and focus on the support of $200 in the near future, if the support is effective, you can test a small number of long orders, only fast forward and fast out, and there are no signs of upward trend. From a fundamental point of view, the valuation is relatively reasonable, and it can be long term in the $200 first-line layout.
2021.9.22 From the technical chart, the stock price is in a downtrend, it is recommended to avoid more orders, focus on the support of $230 in the near future, if the support is effective, you can test a small number of long orders, only fast forward and fast out, there are no signs of upward trend. From a fundamental point of view, the valuation is relatively reasonable, and it can be long term in the $200 first-line layout.
Key Quote Data:
52 Week Range: 141.92-266.79
P/E Ratio(TTM): 11.66
EPS(TTM): $15.18
Market Cap: $44.40 B
Number of employees: 345000 historical data 228000
2022.12.20 Revenue for the second quarter of fiscal 2023 was US$22,814 million, market expectations of $23.74 billion, YoY-2.81%, net income attributable to common shareholders of $788 million, YoY-24.38%, EPS $3.07, YoY-20.88%. A quarterly dividend of $1.15 per share. Second-quarter adjusted earnings per share were $3.18, market estimates of $2.8, $4.83 in the year-ago quarter. Operating income for the third quarter was $1.18 billion , $1.60 billion previously. Full-year adjusted earnings per share were expected to be $13 to $14, expectations of $14.14. Reduced fiscal 2023 capital expenditure guidance by $400 million. Rapid cost reduction actions are being prioritized to align fiscal 2023 costs with weaker expected volumes. (Note: The default is GAAP, Non-GAAP will be explained separately)
Summary of recent financial statements
 Stock Price Trend Forecast and Market Analysis-2022.12.27")
FedEx Corp. (NYSE: FDX) provides customers and businesses worldwide with a broad portfolio of transportation, e-commerce and business services. With annual revenue of $94 billion, the company offers integrated business solutions through operating companies competing collectively, operating collaboratively and innovating digitally under the respected FedEx brand. Consistently ranked among the world’s most admired and trusted employers, FedEx inspires its more than 550,000 employees to remain focused on safety, the highest ethical and professional standards and the needs of their customers and communities. FedEx is committed to connecting people and possibilities around the world responsibly and resourcefully, with a goal to achieve carbon-neutral operations by 2040. To learn more, please visit fedex.com/about.